
AI is driving big innovation in IT operations, with an ever-increasing demand to detect anomalies faster, sooner, and more accurately. Increasingly, organizations are turning to observability solutions to get visibility into their dynamic container-based architectures and hybrid-cloud environments. While observing is critical, the real value comes with the capacity for predictive AIOps.
At Perform 2021, Dynatrace lead data scientist Thomas Natschläger gave a deep dive into the Dynatrace AI engine, Davis. He demonstrated how Davis leverages predictive capabilities to reduce false-positive alert spam and detect new types of anomalies in real-time with pin-point precision.
Reducing false alarms with Davis
For a little background, Davis automatically identifies anomalies within huge cloud deployments out-of-the-box. Then, using deterministic AI, Davis pinpoints the exact root cause of the problem. Davis reduces noise by merging hundreds of disparate events into a consistent incident with full business and operational context.
Natschläger demonstrated how Davis works on high-dimensional, topology-aware data to detect anomalies.
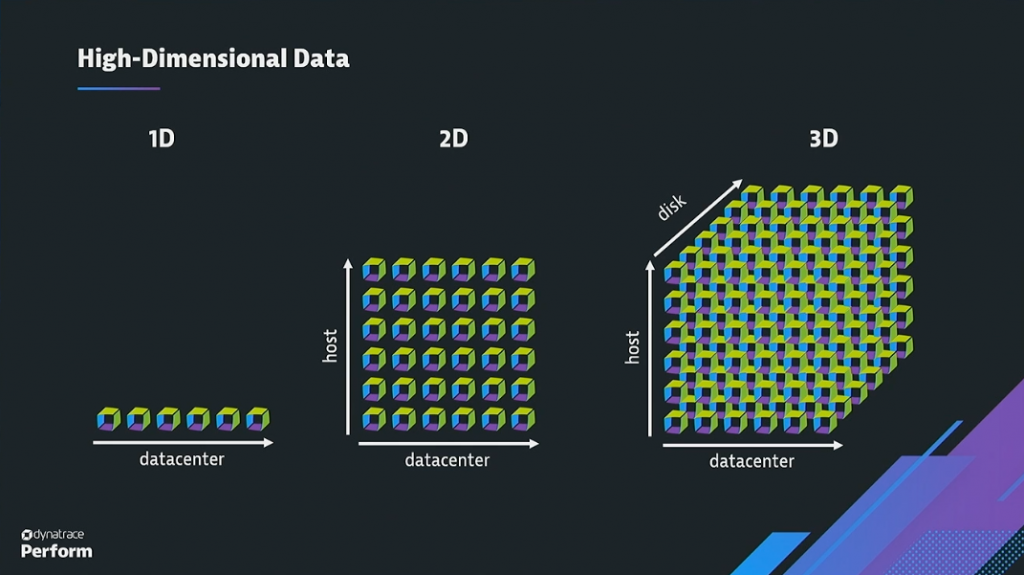
“If you look at a metric like utilization, you can analyze that data along three different aspects, also known as dimensions,” Natschläger explained. “Because teams often have to analyze several dimensions simultaneously, the amount of data can be overwhelming, and challenging to handle manually.”
So, how can Davis handle this problem?
The underlying assumption of the Davis AI engine is that not every one of these individual metrics, timeseries, and unexpected fluctuations are important. Davis focuses on a reduced set of metrics that are important to your application use case.
For example, in an performance monitoring setting, you want to closely monitor user-facing metrics like response time and error rates. With Dynatrace’s AI-driven approach, manually monitoring these metrics is not necessary, because Davis automatically provides anomaly detection for those key metrics only, along with deterministic root-cause and custom alerts, which reduces noise. This reduce-to-the-max approach – applying anomaly detection only to key metrics – reduces the possibility of false alerts.
Custom alerting at scale, from static to auto-adaptive
Custom baselining is where predictive AIOps comes in. Natschläger explained how it works.
“As of now, there are two options for getting alerts through custom metrics,” says Natschläger. “One of them is by setting a monitoring strategy that provides automatic static thresholds.”
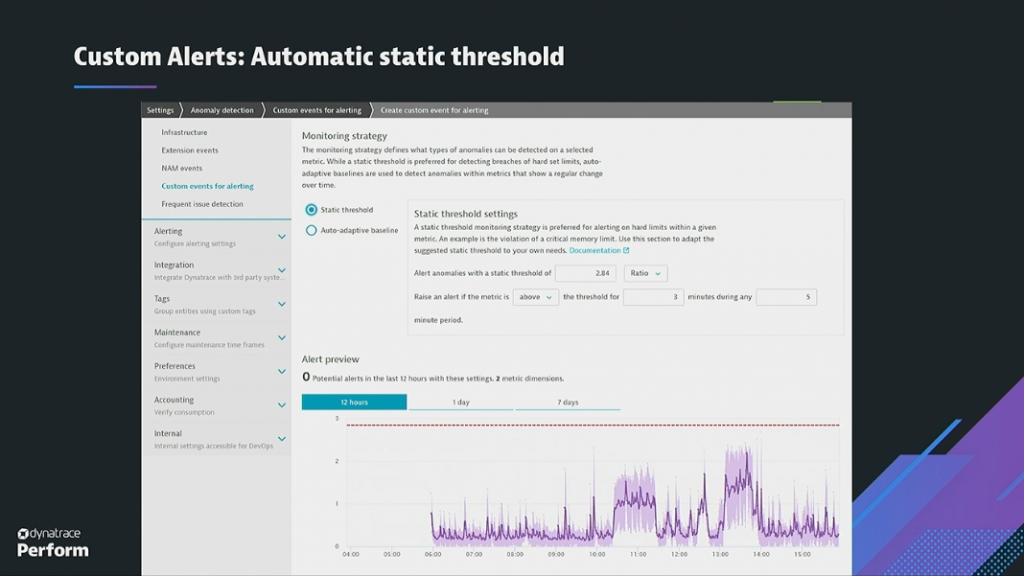
Here, you select a metric and subdimensions, then the Dynatrace AI engine automatically suggests a threshold that makes sense for this particular metric. While you have the option to edit it, this static threshold is specific to this metric by default.
This is a straightforward approach for metrics that you don’t expect to change significantly over time. But of course, there are metrics for which this assumption does not hold. For metrics that fluctuate, Natschläger described, Dynatrace built a second option into Davis, the auto-adaptive baselining feature. This adaptive option leverages the same underlying statistical model as the static threshold, but reapplies these calculations into the historical data, providing an auto-adjusted threshold.
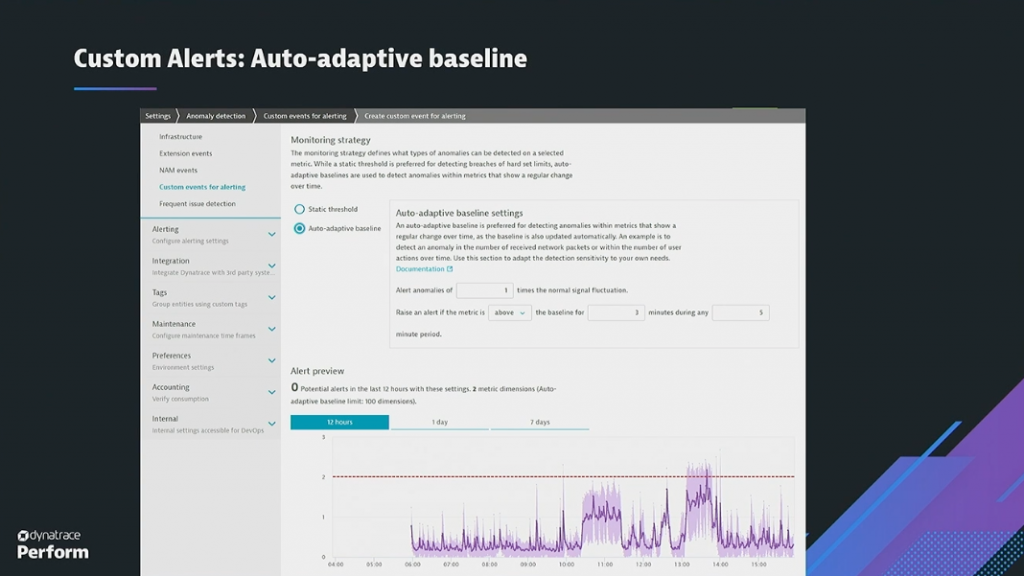
For example, if you have CPU usage that’s increasing more and more over time as your customer base grows, Davis automatically adjusts, without requiring human intervention.
Beyond thresholds into structured time-series models
While many data models are fairly consistent, and anomalies are therefore easy to identify, some have seasonal, daily, or weekly patterns. In these cases, you expect to see regular up- and downs, but still need to know when there are unexpected changes and spikes in behavior, as you can see in the following graphic.
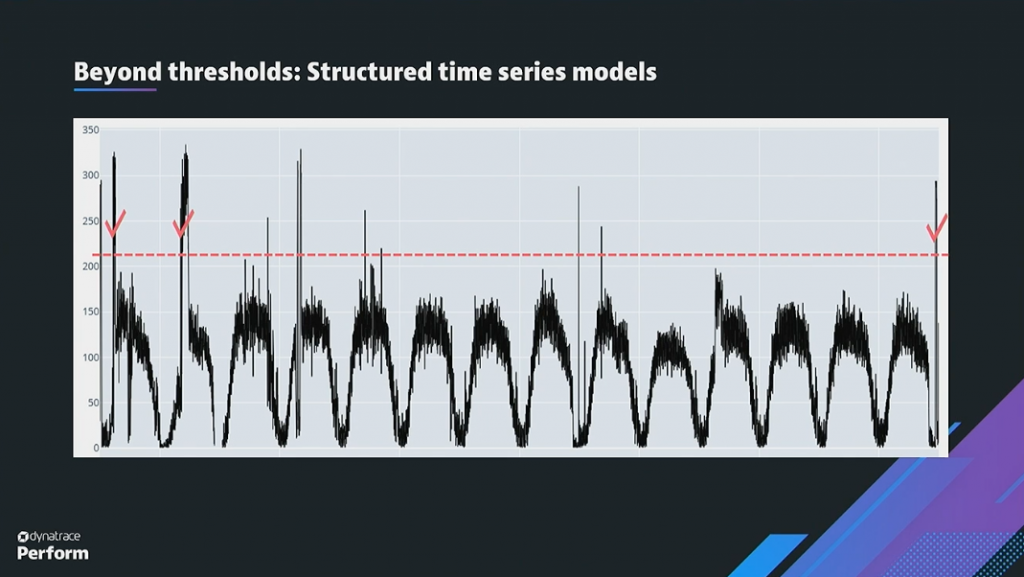
In order to deal with these challenges, you need more complex modeling of time-series data. One approach Dynatrace is building into the platform is a structural time series model. This model automatically identifies underlying seasonal variations, changes in data trends, or autoregressive components, and ignores anomalies in the training process. It also allows AIOps teams to estimate noise and uncertainty within the model, also known as a probabilistic prediction approach. While a point prediction gives a specific number, a probabilistic prediction provides a range of what it expects the likely outcome will be.
This approach to predictive AIOps becomes more and more important when you think about forecasting alerts. By forecasting alerts with probabilistic predictions, teams can detect complex anomalies, including intraday drops, spikes at unusual times, changes in seasonal patterns, unexpected trends, and more.
As Dynatrace builds this capability into the platform, it will be set up to automatically learn any metrics and allow users to adjust the settings to meet their needs.
To learn more about how Dynatrace is building probabilistic prediction AI methods into the Dynatrace platform, watch the full presentation below.


Looking for answers?
Start a new discussion or ask for help in our Q&A forum.
Go to forum