
Dynatrace cross-environment dashboards are capable of combining monitoring artifacts from separate Dynatrace environments and can even support remote management zones.
We’re happy to announce the General Availability of cross-environment dashboarding capabilities (having released this functionality in an Early Adopter release with Dynatrace version 1.172 back in June 2019). In the meantime, we’ve made some major advancements so that you can conveniently report monitoring data without having to build multiple dashboards in separate environments—read on below.
Visualize data from multiple environments on a single dashboard
Monitoring the cloud poses many challenges when it comes to scale. How do you, for instance, manage to keep an eye on all your AWS instances, Kubernetes nodes, on-premise VMs, and the entirety of the user-experience KPIs for all your public and internal applications across multiple staging environments? With growing complexity and variety, you’ll likely want multiple Dynatrace environments so that you can take full advantage of the benefits of segmentation and scale.
Dynatrace dashboards serve as a single pane of glass for monitoring artifacts like metrics, logs, events, user sessions, and server-side traces. With cross-environment dashboards, you can add a completely new dimension in that dashboards are now capable of combining these monitoring artifacts from separate Dynatrace environments and can even support remote management zones.
Best of all, you can now set this up with a single click in the Dynatrace web UI by simply selecting the environment from which a dashboard tile is supposed to pull monitoring data. The Environment selector (see below) displays all remote environments for which a remote connection has been established. The default option of this setting is Local, which configures the tile to pull its data from the local Dynatrace environment. Selecting a different environment here simply redirects the tile’s data query to that environment.
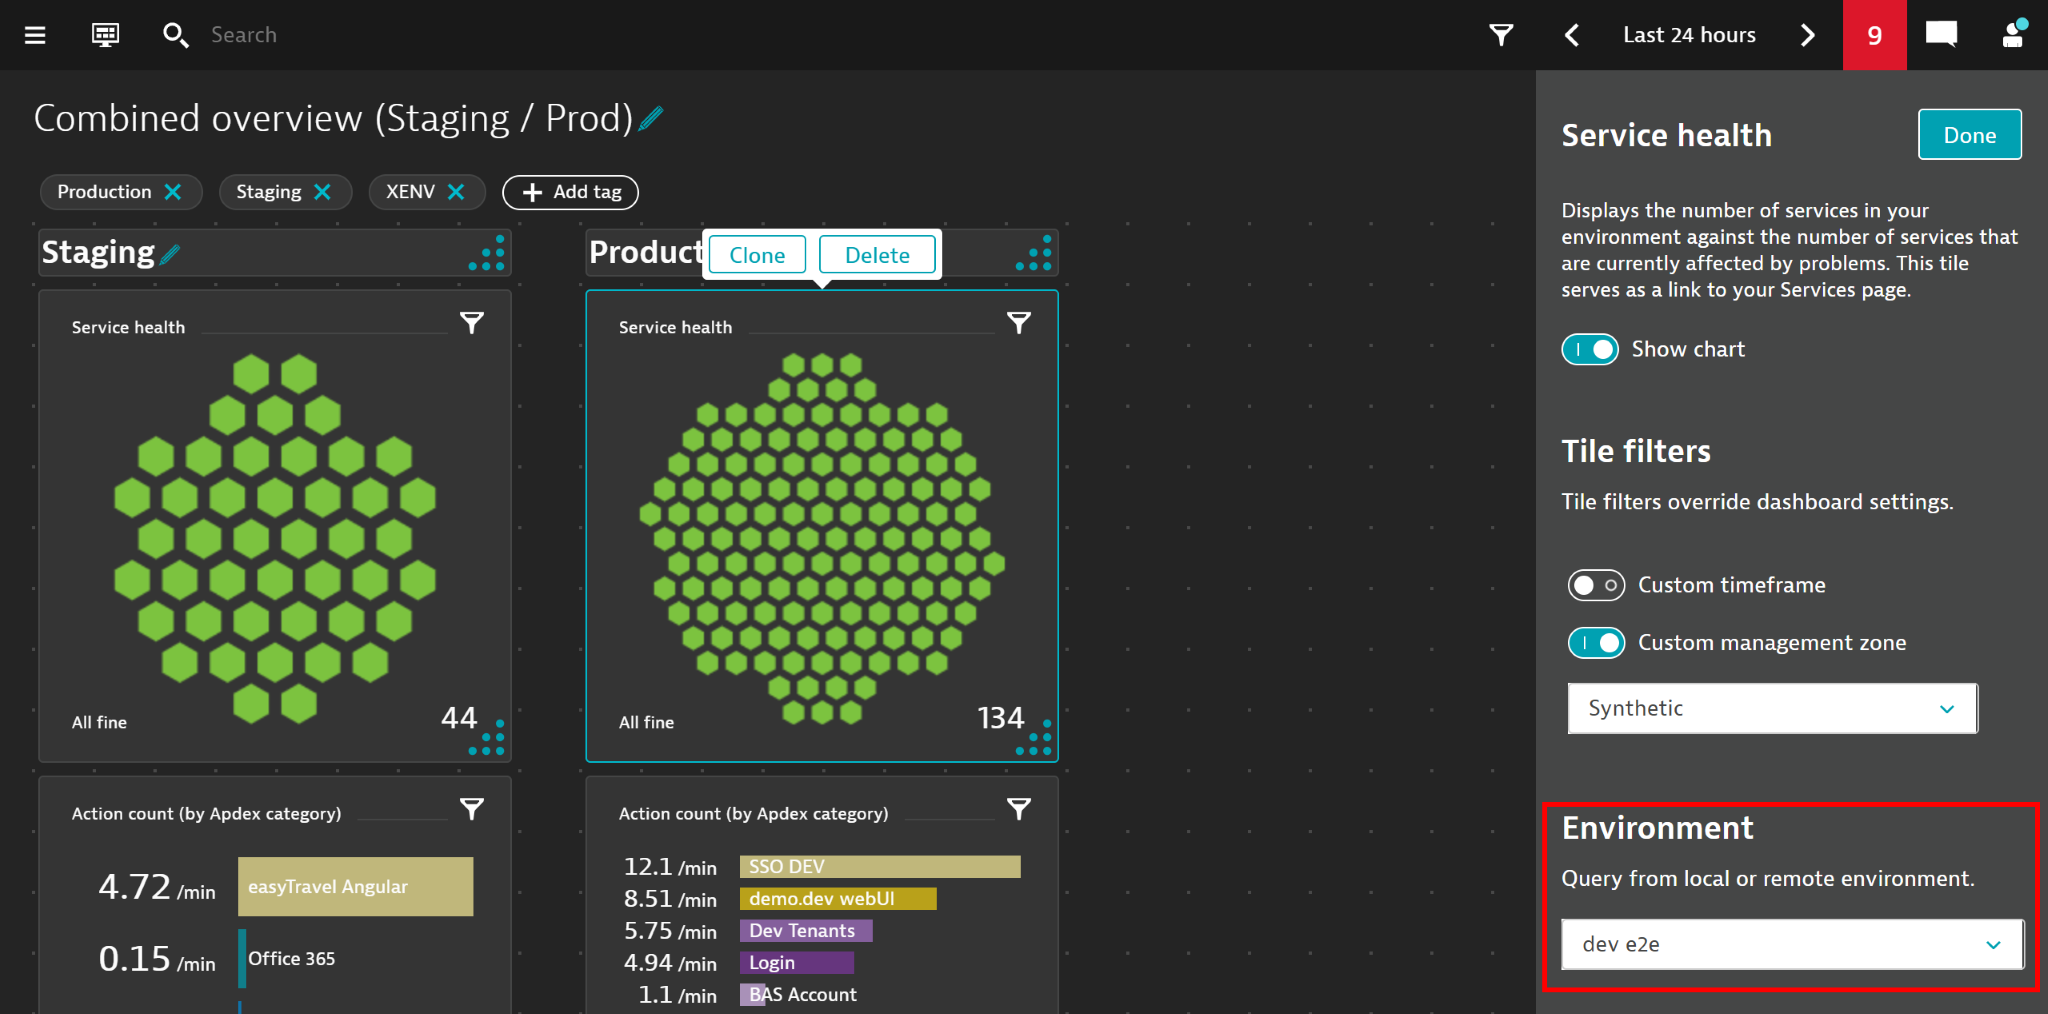
The beauty of this environment configuration is that once a remote environment is selected, the management zone filter (in the top menu bar) lists the management zones that are available in the selected remote environment and allows you to filter for a specific zone at the dashboard-tile level. In this way, you can easily build convenient overview reports, covering multiple environments and multiple management zones all on a single dashboard.
Leverage overview dashboards for problem analysis over multiple environments
As the remote-environment capabilities of dashboard tiles allow you to build a common overview of problems and other data, dashboards can essentially serve as a hub for deeper analysis. A single click on any given dashboard tile depicting remote information takes you straight into a dedicated view of the remote environment where you can continue your analysis.
The boundaries between multiple separate Dynatrace environments don’t matter as much any more. This gives you a boost in efficiency when managing multiple environments.
Link separate environments to benefit from remote capabilities
The first step in cross-environment dashboarding is connecting to a separate, remote environment. This process is now significantly easier, as, in addition to the API capabilities for such automation that we introduced last year, you can now also interactively connect to remote environments in the Dynatrace web UI.
Step 1) Issue an access token for remote environment access from the environment you want to connect to
In the remote environment (holding data you’d like to fetch remotely), go to Settings > Integration > Dynatrace API and issue an API token with the permission to Fetch data from a remote environment. Keep the token secret available for the second and final configuration step.
Step 2) Configure the remote environment connection
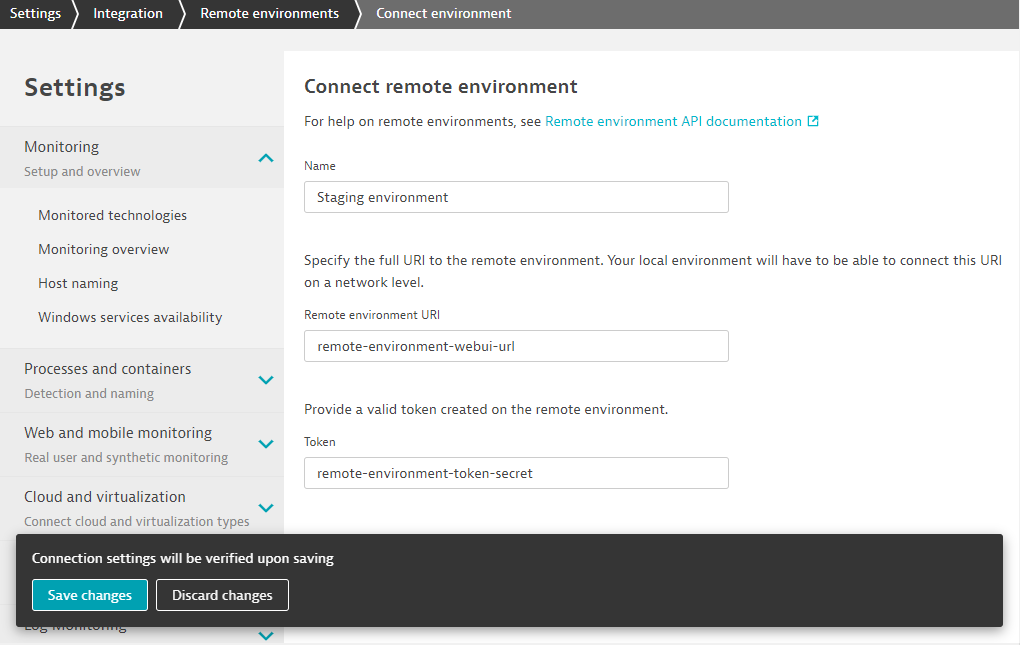
In the environment that will contain your dashboard, go to Settings > Integration > Remote environments to set up the eventual link to the remote environment.
When you save your changes, the connection to the remote environment is verified; if a connection can’t be established (for example, because there’s no connection at a network level), a message will be displayed accordingly.
Important: In Dynatrace Managed environments, you need to configure an additional Network scope setting. This setting and its implications are explained in the API documentation for connecting to remote environments.
What you get with this update
- Full support for remote-environment dashboards
- Full support for different combinations of Dynatrace deployments (i.e., Managed, SaaS)
- Remote-environment drill-down capability
- Convenient configuration for remote-environment connections
Things to keep in mind
- Remote-environment connections don’t pass user context and permissions over environment boundaries. For this reason, using management zones is the best practice in order to segment/limit dashboard tiles when viewing remote information.
- Because of the above consideration, remote-environment dashboards can only be configured by environment administrators. However, regular users can still view and interact with remote-environment dashboards without limitation.
- The World map dashboard tile isn’t suited for (and therefore doesn’t support) remote-environment scenarios.
What’s next?
We’re always looking to improve. Our next objective is to respect the user permissions of dashboard consumers across environment boundaries. We’re looking forward to your feedback on how remote-environment dashboards can be deployed and provide value in your monitoring own scenarios. Please share your questions and feedback with us at Dynatrace Community.


Looking for answers?
Start a new discussion or ask for help in our Q&A forum.
Go to forum