
We introduced Dynatrace’s Digital Business Analytics in part one, as a way for our customers to tie business metrics to application performance and user experience, delivering unified insights into how these metrics influence business milestones and KPIs.
In part two, we provided a quick peek behind the curtains on getting started with Digital Business Analytics dashboards. As like everything else in technology, dashboarding has evolved as the line between a dashboard and web page has faded. In the past, these were designed to display data on a glass in isolation, and whilst this was a good start (as dashboards provide visibility into things like infrastructure and business), traditional dashboards had many shortcomings.
In this part of the series, I’ll explore these shortcomings in more detail and explain how Dynatrace can accelerate your journey from traditional to modern dashboards that provide answers using Digital Business Analytics.

“This is way too difficult, and I don’t have the time.”
Traditionally, the approach for creating dashboards would start by getting requirements from an internal group within your organization. Then, you’d have a meeting to review the requirements, before researching how to access and transform data, to then build a mockup dashboard. Once completed, you’d then need to schedule another meeting to review the mockup dashboard and get approvals.
After those steps are completed, you’re now ready to build a traditional dashboard, then once you’ve finished and fully tested the traditional dashboard, you can then deliver the finished product. You’ll then need to repeat this process over and over to satisfy all the functional groups that you support from business stake holders to operations. From the requirement phase through to delivery, delivering a single traditional dashboard typically takes a few hours for simple requests or several days for more complex requests.
Now What about revenue forecasting? Are these dashboards all standalone or are they linked together in logical sense? What about a dashboard for revenue generated by Platinum or premium users? Does anyone have time for all this?
“We have way too many dashboards and I can’t find my main dashboard!”
A major struggle for anyone that builds dashboards is managing dashboard explosion. Every functional group in your organization is not just requesting a single dashboard, they want it all. Teams need data visualized in different ways so they can make informed decisions. This leads to lots of dashboards for multiple functional groups across many applications. But how do you find the correct dashboard your business stakeholder needs? How do you find the time to update all these dashboards? Pretty soon, your dashboards will become outdated and will not be utilized as they were designed for. Then what happens next? Your business stakeholders will be making decisions without current and reliable dashboards to support their reasoning.
Do we really need dashboards?
With advancements in artificial intelligence (AI), machine learning and self-healing, one begins to wonder if dashboards are even needed anymore. I empathically say “YES”, we need and love dashboards!
We’re a visual society, which will never change, however simply putting data on a glass without any ability to interact with the data will lead to frustration and is pointless. If I’m viewing a dashboard that tells me I have a CPU spike and I have no ability to interact with the data and get answers, what value have I provided with this dashboard? AI and self-healing will identify and fix the issue, so what is the point of simply watching something without the ability to interact, manipulate and get answers?
Dynatrace BizOps Configurator
The Dynatrace BizOps Configurator is a Single Page App (SPA) that gets inputs from the user and the Dynatrace API, transforms a stock collection of curated dashboard packs, and uploads the dashboards via the Dynatrace API. We organized the dashboard packs based on two dimensions:
Persona: Who is the audience for the dashboards? For example, an Application Overview might look different for a Developer vs Line of Business vs IT Exec.
Use Case: What’s the purpose of the dashboards?
Don’t have time to create dashboards? Creating dashboards with the BizOps Configurator takes just seconds. Have too many dashboards? With the BizOps Configurator, you have total control and using the Persona and Use Case dimensions, you can deploy only what you need. Do you need to update your dashboards due to a change like a new marketing campaign or a change of your application name, or remove some obsolete dashboards or remove dashboards owned by an employee that has left your organization? Again, these actions take seconds. And what if you can’t find your dashboard? The BizOps Configurator utilizes smart tagging which makes finding the right dashboard at the right time a breeze. You can also mark any dashboard as a favorite and your favorite dashboards will always be listed at the top of your dashboard list.
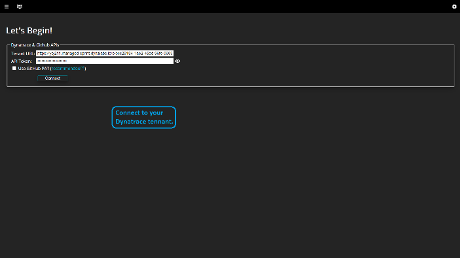
Let’s put the BizOps Configurator to use. After launching the BizOps Configurator, I’m prompted for my tenant and token credentials. The BizOps Configurator supports both SaaS and Managed tenants, and your token needs Metrics, Read, Write and User Session switches enabled. Click on connect.
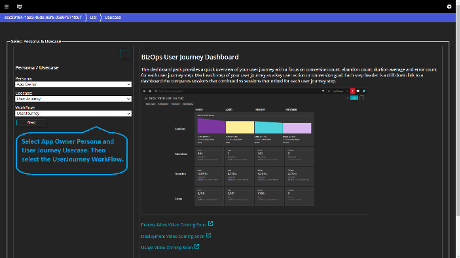
After selecting New Flow Deploy, I then select my Presona, Usecase and Workflow. Once the selections are made, you’ll notice documentation on the right. A brief description of the dashboard pack and screenshot is provided. You will also see additional information on prerequisites and links to training videos. Select the User Journey Workflow. Click on Next.
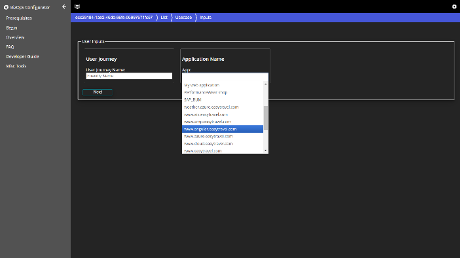
Give your User Journey a name and select your application. If your User Journey spans across many applications, simply pick each application in the dropdown list. Click Next.
My User Journey has four steps and I drag each step onto the funnel graphic. Then click Next.
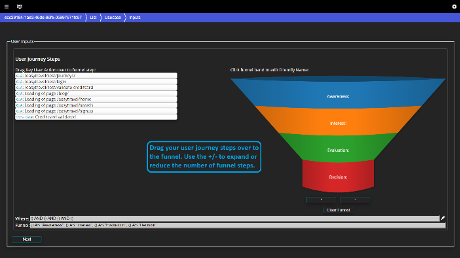
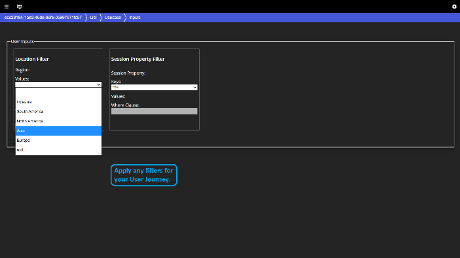
I enter any filters (i.e. Platinum Users) for my User Journey and then select Done.
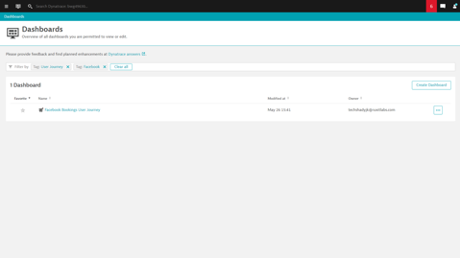
It’s that easy. Dynatrace tags were smartly deployed, making it easy to locate my User Journey Dashboard.
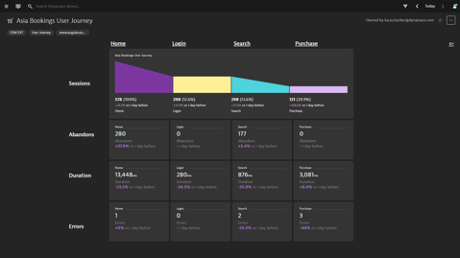
I can see most of the sessions are exiting the user journey at the homepage step. My next blog will explore the User Journey Dashboard in more detail and will provide answers into the root cause of homepage bounces.
Fast automated deployment. Smart tagging for easy access. Answers. Only with Dynatrace Digital Busines Analytics.
Check out the current list of BizOps dashboards (more added each week).
Do you have awesome dashboards and would like to contribute to the Dynatrace Community? Visit the BizOps Configurator Forum and drop us a note.
And this concludes the three-part blog series for Digital Business Analytics.

Looking for answers?
Start a new discussion or ask for help in our Q&A forum.
Go to forum