
Up to HammerDB v4.0 you have had the ability to do time profiling for the first Active Virtual User only. This post showed you how to graph the transaction response times using this package called etprof. v4.1 enhances time profiling by introducing a new package called xtprof that enables you to capture timing data for all Active Virtual Users simultaneously. This post will get you started with time profiling in v4.1.
Time profiling of a workload is the process of capturing transaction response times. Response times give us multiple insights beyond just transaction rates in the form of NOPM and TPM. NOPM shows us the new orders per minute so the number of new order transactions only. TPM shows us the user commits and user rollbacks across the whole database, however with both values we are recording the average transaction rate across a minute. With the transaction counter this shows us how even this transaction rate is across the measured time, however time profiling enables a much finer granular view on the workload of each Virtual User.
Within the TPROC-C workload there is a transaction mix of neword 45%, payment 43%, delivery 4%, order status 4%, stock level 4%. The transaction to run is selected according to this mix and NOPM records only 45% of this mix. Note that for example New Order is called 45% of the time however the actual time ratio attributed to the transaction could be longer or shorter.
So using the test workload as an example for a single Virtual User they will run a sequence of transactions such as follows.
Vuser 1:order status
Vuser 1:payment
Vuser 1:payment
Vuser 1:new order
Vuser 1:new order
Vuser 1:new order
Vuser 1:stock level
Vuser 1:new order
Vuser 1:payment
Vuser 1:payment
Vuser 1:payment
Vuser 1:new order
Vuser 1:payment
Vuser 1:payment
Vuser 1:order status
Vuser 1:new order
Vuser 1:new order
Vuser 1:payment
Vuser 1:new order
Vuser 1:delivery
Looking at this single Virtual User if for example the Stock Level or Order Status transactions takes longer, then it should be clear they are going to be able to run fewer New Orders in a minute because while they are running other transactions they are not recording any New Order transactions.
However, it is in most cases not just one Virtual User, instead it is tens, hundreds or thousands running at the same time and the database is managing the concurrency between them. Stock Level for example is querying the district, stock and order_line tables so while other virtual users are inserting and updating these tables with New Order and Payment or deleting with Delivery, Stock Level is doing a longer running query with locks and multiversioning to ensure that the data is consistent. A very basic database approach for Stock Level would be to lock the tables to ensure consistency, however doing this would block any other transactions from running until Stock Level was complete resulting in low performance overall. This is the very design of TPC-C specification in that the transactions are intended to do inserts, updates, deletes and queries on the data at the same time to test how well the database engine can manage the concurrency. Time profiling can give you a deeper insight into how well this is managed.
To begin using extended profiling view the settings in the generic.xml file in the config directory. From v4.1 the default profiler will be the newer xtprof, however this can be changed back to etprof to use the earlier single Virtual User profiler. As xtprof profiles all Virtual Users output now gets written to a dedicated log file and therefore there is the option of whether a unique log name is required, 0 for a regular filename and 1 for a unique id.
<timeprofile>
<profiler>xtprof</profiler>
<xt_unique_log_name>0</xt_unique_log_name>
</timeprofile>
With the profiler setting set to xtprof HammerDB will use the new profiler automatically enabling it for all Virtual Users when selected.
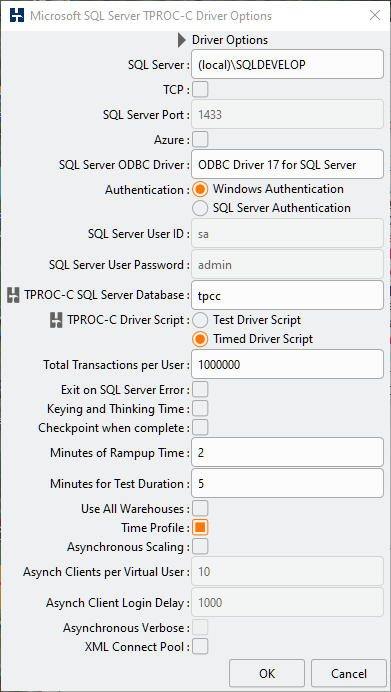
To enable time profiling when configuring the driver script select the time profiling option.
In the CLI set the timeprofile option to true.
hammerdb>diset tpcc mssqls_timeprofile true
Changed tpcc:mssqls_timeprofile from false to true for MSSQLServer
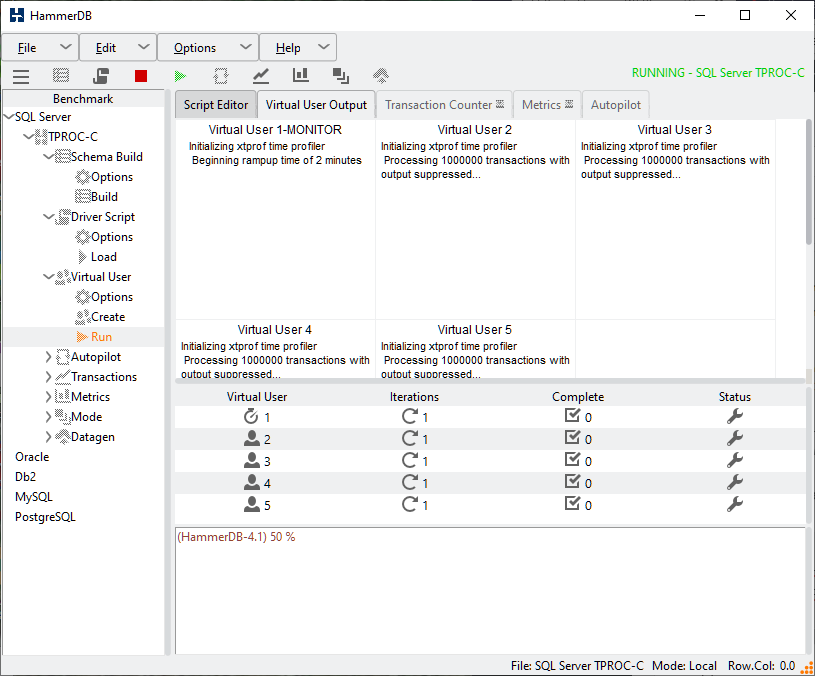
When running a workload you will now see a message “Initializing xtprof time profiler” in all Virtual Users. Note that the package initializes in the Monitor Virtual User also as all data is gathered, processed and reported by the Monitor.
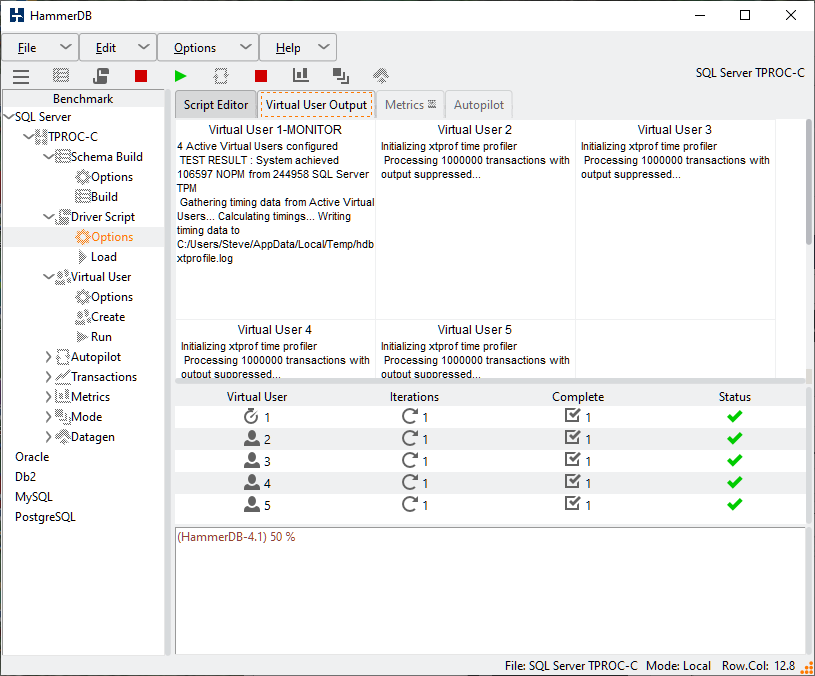
When the workload is complete after reporting the NOPM/TPM the Monitor Virtual User will report messages on Gathering timing data/Calculating timings and Writing timing data to an external logfile to mark the separate stages of gathering and processing the data.
In the logfile there is a report of the timings for all of the Active Virtual Users followed by a summary of the cumulative data.
In the report the values have the following meaning with all timings in milliseconds.
| Value | Description |
|---|---|
| CALLS | Number of times that the stored procedure was called. |
| MIN | Minimum response time in milliseconds. |
| AVG | Average response time in milliseconds. |
| MAX | Maximum response time in milliseconds. |
| TOTAL | Total time spent in that stored procedure during the measuring interval. The total time will include both rampup and timed test times. |
| P99 | 99th percentile in milliseconds. |
| P95 | 95th percentile in milliseconds. |
| P50 | 50th percentile in milliseconds. |
| SD | Standard Deviation showing variance in captured values. |
| RATIO | Ratio showing percentage time taken for that stored procedure. The total of these values may be less than 100% as only timings for the stored procedures are shown. |
+-+-+-+-+-+-+-+-+-+-+-+-+-+-+-+-+-+-+-+-+-+-+-+-+-+-+-+-+-+-+-+-+-+-+-+-+-+
MSSQLServer Hammerdb Time Profile Report @ Thu May 06 13:37:27 BST 2021
+-+-+-+-+-+-+-+-+-+-+-+-+-+-+-+-+-+-+-+-+-+-+-+-+-+-+-+-+-+-+-+-+-+-+-+-+-+
>>>>> VIRTUAL USER 2 : ELAPSED TIME : 420128ms
>>>>> PROC: NEWORD
CALLS: 173439 MIN: 0.481ms AVG: 0.938ms MAX: 1247.509ms TOTAL: 162638.013ms
P99: 2.147ms P95: 1.358ms P50: 0.842ms SD: 40379.430 RATIO: 38.712%
>>>>> PROC: PAYMENT
CALLS: 174701 MIN: 0.370ms AVG: 0.774ms MAX: 1191.065ms TOTAL: 135295.676ms
P99: 2.108ms P95: 1.261ms P50: 0.648ms SD: 39317.110 RATIO: 32.203%
>>>>> PROC: DELIVERY
CALLS: 17433 MIN: 1.483ms AVG: 3.351ms MAX: 552.191ms TOTAL: 58422.210ms
P99: 7.287ms P95: 5.305ms P50: 3.121ms SD: 47931.042 RATIO: 13.906%
>>>>> PROC: SLEV
CALLS: 17686 MIN: 0.637ms AVG: 2.044ms MAX: 640.690ms TOTAL: 36157.299ms
P99: 2.260ms P95: 1.740ms P50: 1.214ms SD: 194033.832 RATIO: 8.606%
>>>>> PROC: OSTAT
CALLS: 17189 MIN: 0.236ms AVG: 0.907ms MAX: 425.793ms TOTAL: 15597.346ms
P99: 1.776ms P95: 1.346ms P50: 0.716ms SD: 62930.031 RATIO: 3.713%
+-+-+-+-+-+-+-+-+-+-+-+-+-+-+-+-+-+-+-+-+-+-+-+-+-+-+-+-+-+-+-+-+-+-+-+-+-+
>>>>> VIRTUAL USER 3 : ELAPSED TIME : 419621ms
>>>>> PROC: NEWORD
CALLS: 175953 MIN: 0.492ms AVG: 0.940ms MAX: 1031.020ms TOTAL: 165474.149ms
P99: 2.172ms P95: 1.373ms P50: 0.842ms SD: 37665.637 RATIO: 39.434%
>>>>> PROC: PAYMENT
CALLS: 176330 MIN: 0.360ms AVG: 0.770ms MAX: 942.985ms TOTAL: 135763.464ms
P99: 2.131ms P95: 1.269ms P50: 0.648ms SD: 28595.491 RATIO: 32.354%
>>>>> PROC: DELIVERY
CALLS: 17424 MIN: 1.449ms AVG: 3.351ms MAX: 1051.259ms TOTAL: 58383.716ms
P99: 7.215ms P95: 5.295ms P50: 3.110ms SD: 81873.726 RATIO: 13.913%
>>>>> PROC: SLEV
CALLS: 17662 MIN: 0.670ms AVG: 1.759ms MAX: 1719.874ms TOTAL: 31063.587ms
P99: 2.240ms P95: 1.755ms P50: 1.226ms SD: 181722.634 RATIO: 7.403%
>>>>> PROC: OSTAT
CALLS: 17431 MIN: 0.240ms AVG: 0.984ms MAX: 366.508ms TOTAL: 17150.844ms
P99: 1.771ms P95: 1.351ms P50: 0.716ms SD: 78557.793 RATIO: 4.087%
+-+-+-+-+-+-+-+-+-+-+-+-+-+-+-+-+-+-+-+-+-+-+-+-+-+-+-+-+-+-+-+-+-+-+-+-+-+
>>>>> VIRTUAL USER 4 : ELAPSED TIME : 419456ms
>>>>> PROC: NEWORD
CALLS: 187196 MIN: 0.481ms AVG: 0.923ms MAX: 871.146ms TOTAL: 172755.826ms
P99: 2.133ms P95: 1.274ms P50: 0.821ms SD: 34184.264 RATIO: 41.186%
>>>>> PROC: PAYMENT
CALLS: 187555 MIN: 0.362ms AVG: 0.729ms MAX: 1011.880ms TOTAL: 136729.814ms
P99: 1.894ms P95: 1.177ms P50: 0.629ms SD: 26574.336 RATIO: 32.597%
>>>>> PROC: DELIVERY
CALLS: 18767 MIN: 1.430ms AVG: 2.560ms MAX: 141.821ms TOTAL: 48042.982ms
P99: 4.802ms P95: 3.548ms P50: 2.415ms SD: 19616.865 RATIO: 11.454%
>>>>> PROC: SLEV
CALLS: 18839 MIN: 0.648ms AVG: 1.700ms MAX: 630.934ms TOTAL: 32031.203ms
P99: 2.085ms P95: 1.651ms P50: 1.190ms SD: 144279.102 RATIO: 7.636%
>>>>> PROC: OSTAT
CALLS: 18747 MIN: 0.225ms AVG: 0.951ms MAX: 359.600ms TOTAL: 17822.935ms
P99: 1.781ms P95: 1.331ms P50: 0.705ms SD: 72273.598 RATIO: 4.249%
+-+-+-+-+-+-+-+-+-+-+-+-+-+-+-+-+-+-+-+-+-+-+-+-+-+-+-+-+-+-+-+-+-+-+-+-+-+
>>>>> VIRTUAL USER 5 : ELAPSED TIME : 419300ms
>>>>> PROC: NEWORD
CALLS: 186330 MIN: 0.478ms AVG: 0.917ms MAX: 1004.861ms TOTAL: 170810.498ms
P99: 2.079ms P95: 1.281ms P50: 0.826ms SD: 33795.633 RATIO: 40.737%
>>>>> PROC: PAYMENT
CALLS: 185915 MIN: 0.359ms AVG: 0.737ms MAX: 1051.469ms TOTAL: 136976.940ms
P99: 1.893ms P95: 1.186ms P50: 0.633ms SD: 38761.422 RATIO: 32.668%
>>>>> PROC: DELIVERY
CALLS: 18506 MIN: 1.436ms AVG: 2.584ms MAX: 184.669ms TOTAL: 47813.602ms
P99: 4.927ms P95: 3.574ms P50: 2.444ms SD: 22552.186 RATIO: 11.403%
>>>>> PROC: SLEV
CALLS: 18723 MIN: 0.642ms AVG: 1.759ms MAX: 709.370ms TOTAL: 32932.960ms
P99: 2.057ms P95: 1.654ms P50: 1.189ms SD: 150924.608 RATIO: 7.854%
>>>>> PROC: OSTAT
CALLS: 18558 MIN: 0.230ms AVG: 1.009ms MAX: 554.386ms TOTAL: 18718.672ms
P99: 1.763ms P95: 1.349ms P50: 0.711ms SD: 89937.214 RATIO: 4.464%
+-+-+-+-+-+-+-+-+-+-+-+-+-+-+-+-+-+-+-+-+-+-+-+-+-+-+-+-+-+-+-+-+-+-+-+-+-+
>>>>> SUMMARY OF 4 ACTIVE VIRTUAL USERS : MEDIAN ELAPSED TIME : 419539ms
>>>>> PROC: NEWORD
CALLS: 722918 MIN: 0.478ms AVG: 0.929ms MAX: 1247.509ms TOTAL: 671678.272ms
P99: 2.134ms P95: 1.323ms P50: 0.832ms SD: 36516.643 RATIO: 40.025%
>>>>> PROC: PAYMENT
CALLS: 724501 MIN: 0.359ms AVG: 0.752ms MAX: 1191.065ms TOTAL: 544765.715ms
P99: 2.016ms P95: 1.222ms P50: 0.639ms SD: 33766.268 RATIO: 32.462%
>>>>> PROC: DELIVERY
CALLS: 72130 MIN: 1.430ms AVG: 2.948ms MAX: 1051.257ms TOTAL: 212662.428ms
P99: 6.728ms P95: 4.638ms P50: 2.661ms SD: 49195.620 RATIO: 12.672%
>>>>> PROC: SLEV
CALLS: 72910 MIN: 0.637ms AVG: 1.813ms MAX: 1719.871ms TOTAL: 132185.007ms
P99: 2.165ms P95: 1.700ms P50: 1.204ms SD: 168407.157 RATIO: 7.877%
>>>>> PROC: OSTAT
CALLS: 71925 MIN: 0.225ms AVG: 0.963ms MAX: 554.387ms TOTAL: 69289.775ms
P99: 1.775ms P95: 1.344ms P50: 0.712ms SD: 76749.333 RATIO: 4.129%
+-+-+-+-+-+-+-+-+-+-+-+-+-+-+-+-+-+-+-+-+-+-+-+-+-+-+-+-+-+-+-+-+-+-+-+-+-+
Some key observations are to note that time profiling begins immediately for each Virtual User and includes both rampup and timed durations. For this reason by default the captured time for the first Virtual User will be longer than the second and so on because there is a pause between each starting. It is a proposal to Exclude ramp up duration for time profiling #233 and this may be an enhancement for a future version. Also note that for the summary the elapsed times will be proprtionally longer than the duration of the test as it is recording the elapsed time for all Virtual Users.
Typically the key metrics you will want to observe will be P95 & P99 as this shows that 95% and 99% respectively of transactions completed inside this time. You would normally expect the total elapsed time to be in the order of NEWORD, PAYMENT, DELIVERY, SLEV, OSTAT however this may vary for some databases when higher levels of locking are experienced. Finally the SD value or standard deviation can give an indication of the variance between the recorded values. A higher variation gives an indication of less consistent transaction processing times.
Finally for advanced users comfortable with examining the HammerDB source code in the xtprof module there is the following comment as a reference point.
#At this point [dict get $monitortimings $vutr $sproc clickslist] will return all unsorted data points for vuser $vutr for stored proc $sproc
#To record all individual data points for a virtual user write the output of this command to a file
As shown in the comment at this section of the code if desired you can use the commands given to print out all individual data points for all Virtual Users for advanced plotting and analysis of timing data. This is also functionality considered for future releases beyond v4.1 and a potential area for future code contribution.