

As one of the most widely used enterprise service buses, IBM Integration Bus helps enterprises to connect different types of applications by defining message flows between them. For instance, IIB can be used to integrate all the internal and external applications involved when a customer places an order. This can be a first check with the inventory management system to see if there are enough goods in stock. If there are enough goods available, the CRM system is contacted to get the correct discount agreement for the ordered goods with the customer. If everything is fine, a confirmation is sent out to the customer. As you might imagine, such integration scenarios can become quite complex, and, as they are often part of a company’s core business processes, it’s key that they run flawlessly.
Therefore, we recently announced that OneAgent can provide out-of-the-box visibility into your IBM Integration Bus message flows. Besides having automatic end-to-end visibility into your IIB applications and message flows, it’s important to be aware of failures that occur in the course of these message flows. As IBM Integration Bus offers several ways of handling anticipated failures gracefully from both the technical and the business perspective, it’s important to be able to detect and handle failures in the correct way. With the OneAgent version 1.169 release, we’ve now added support for automatically detecting and handling exceptions that are thrown along the message flow.
Automatic detection of thrown exceptions
IIB message flows allow for graceful handling of anticipated exceptions and failures, usually by using throw nodes that are called when exceptions occur during message flow execution. You can define an exception message, a catalog, and a failure number within throw nodes to get more details about an exception. In combination with explicit try/catch nodes or catch terminals, this allows for complex message flows. Dynatrace OneAgent now supports such cases in an automated manner. If an exception is caught at the root input node, the message flow execution is automatically counted as failed and included in the overall error rate of the service.
For example, the message flow depicted in the image below defines what happens when a Receive Retail Request is received by IIB through an MQ input node. If everything goes well and all necessary data is available, the Receive Retail Request is processed in the ProcessOrder compute node, and the flow continues in an Order Item Request, Stock Check Request, or Purchase Item Request, and the message is put on the relevant IBM MQ endpoints.
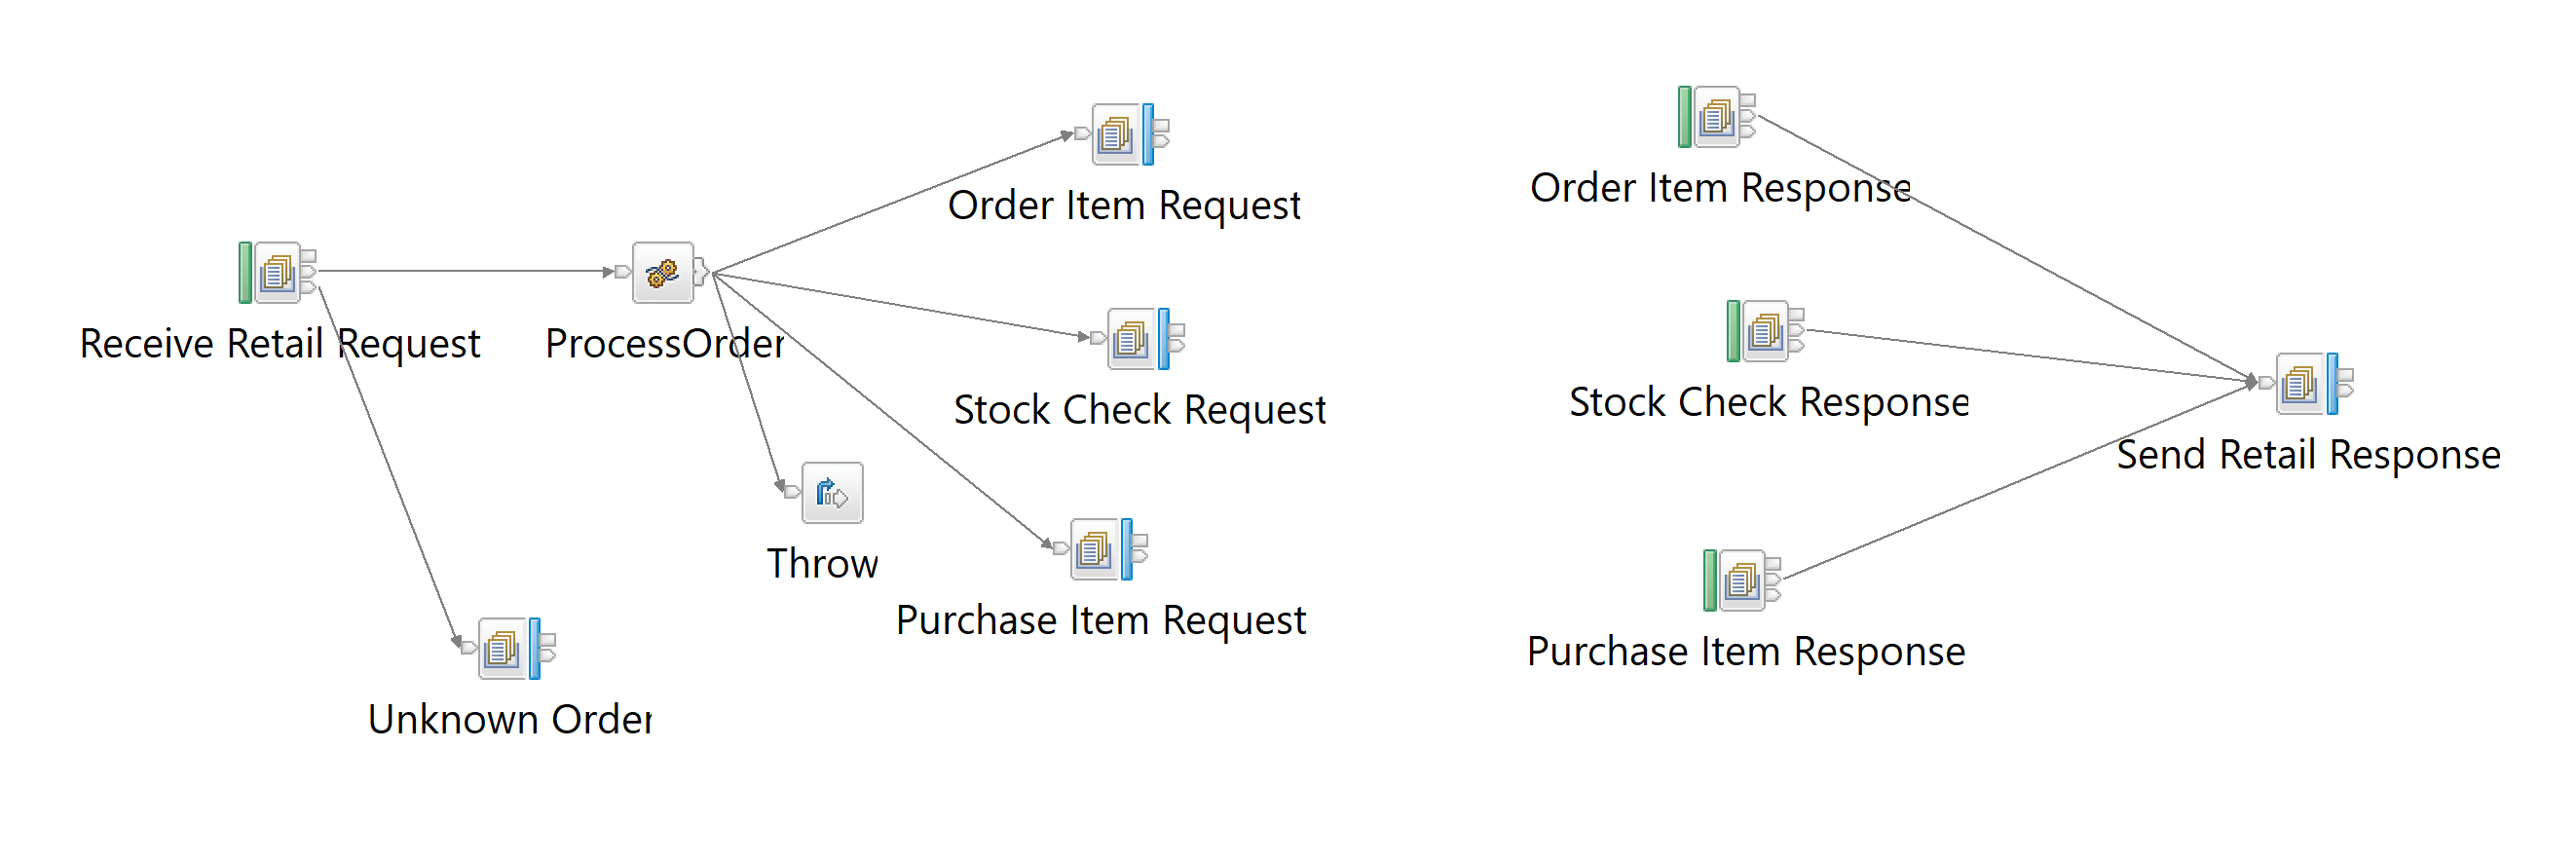
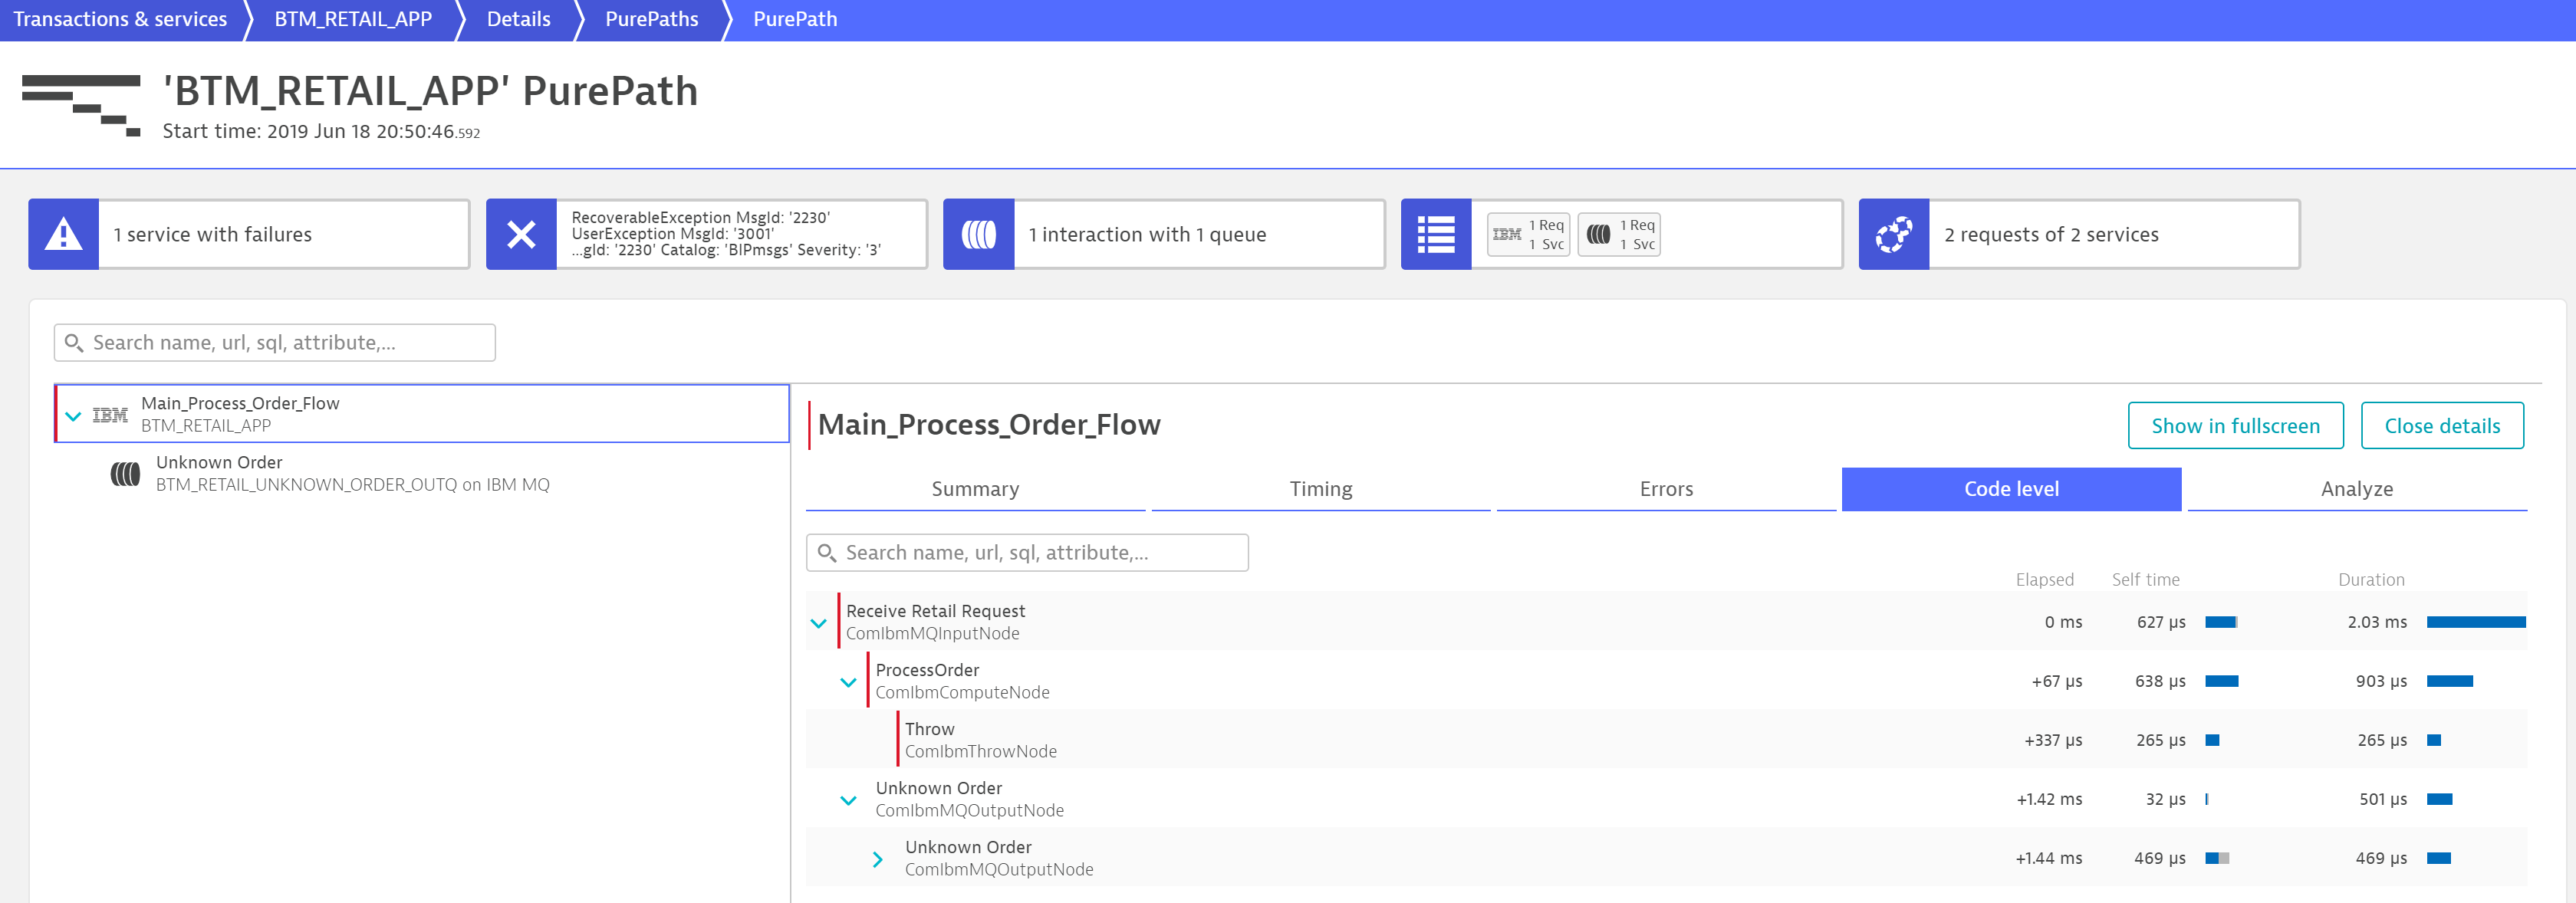
If something goes wrong in the ProcessOrder node, the Throw node is called and the whole transaction is reverted to the input node where the catch terminal is called and the available information is put in the Unknown Order queue. Dynatrace doesn’t just automatically trace the message flow, it also collects relevant information about the exceptions that have been defined in the Throw node. The image below shows what a PurePath looks like in such a case.
To fine tune the automatic handling of such exceptions, you can also use the custom errors settings of a service to either ignore specific exceptions that should not be detected as failures or add them if they are gracefully handled for OneAgent and aren’t thrown back to the input node.
Error detection and investigating exceptions
If an entire message flow fails because an exception is thrown back to the input node, Dynatrace automatically considers this in the failure analysis of the IIB service.
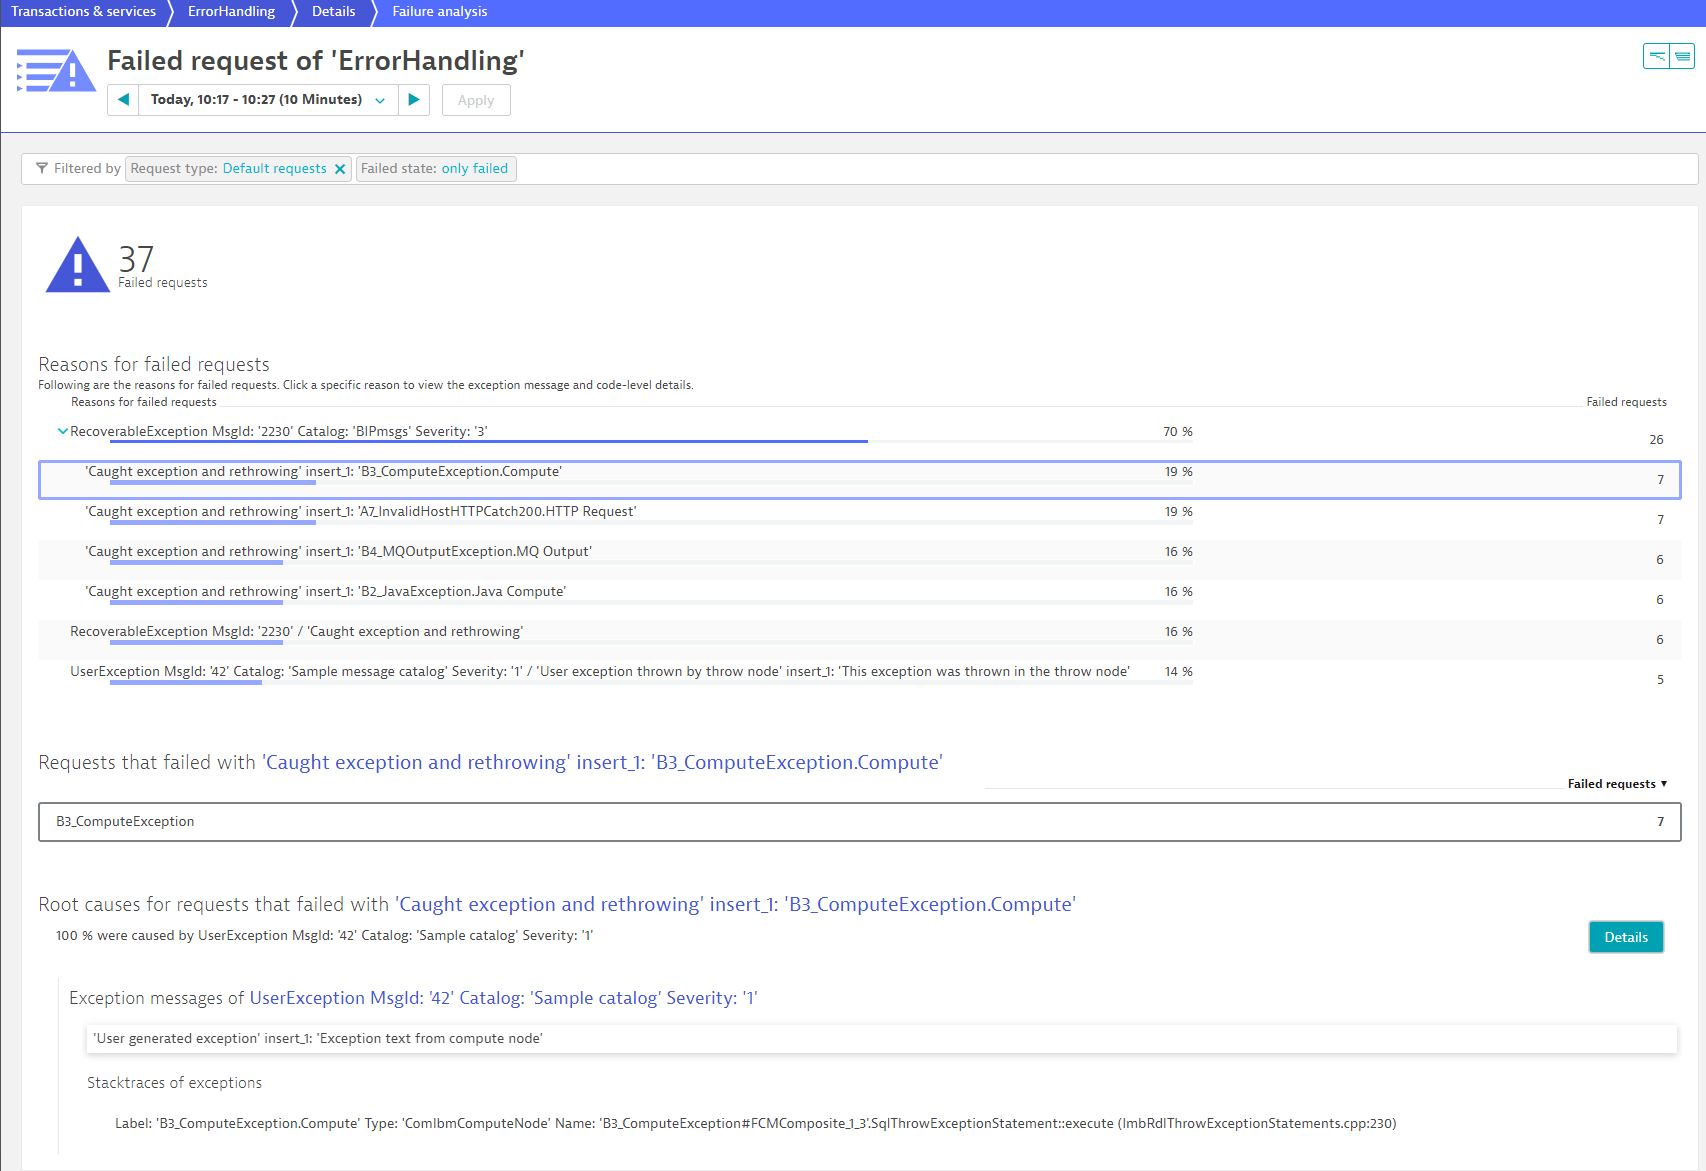
As you can see from the image above, the exception type (for example, UserException or RecoverableException), the catalog, where more detailed information about a specific failure is listed, and even the severity (if provided on the exception) are shown in the failure analysis. When you select an exception, you can see all message flows (as requests) that have failed with that specific exception.
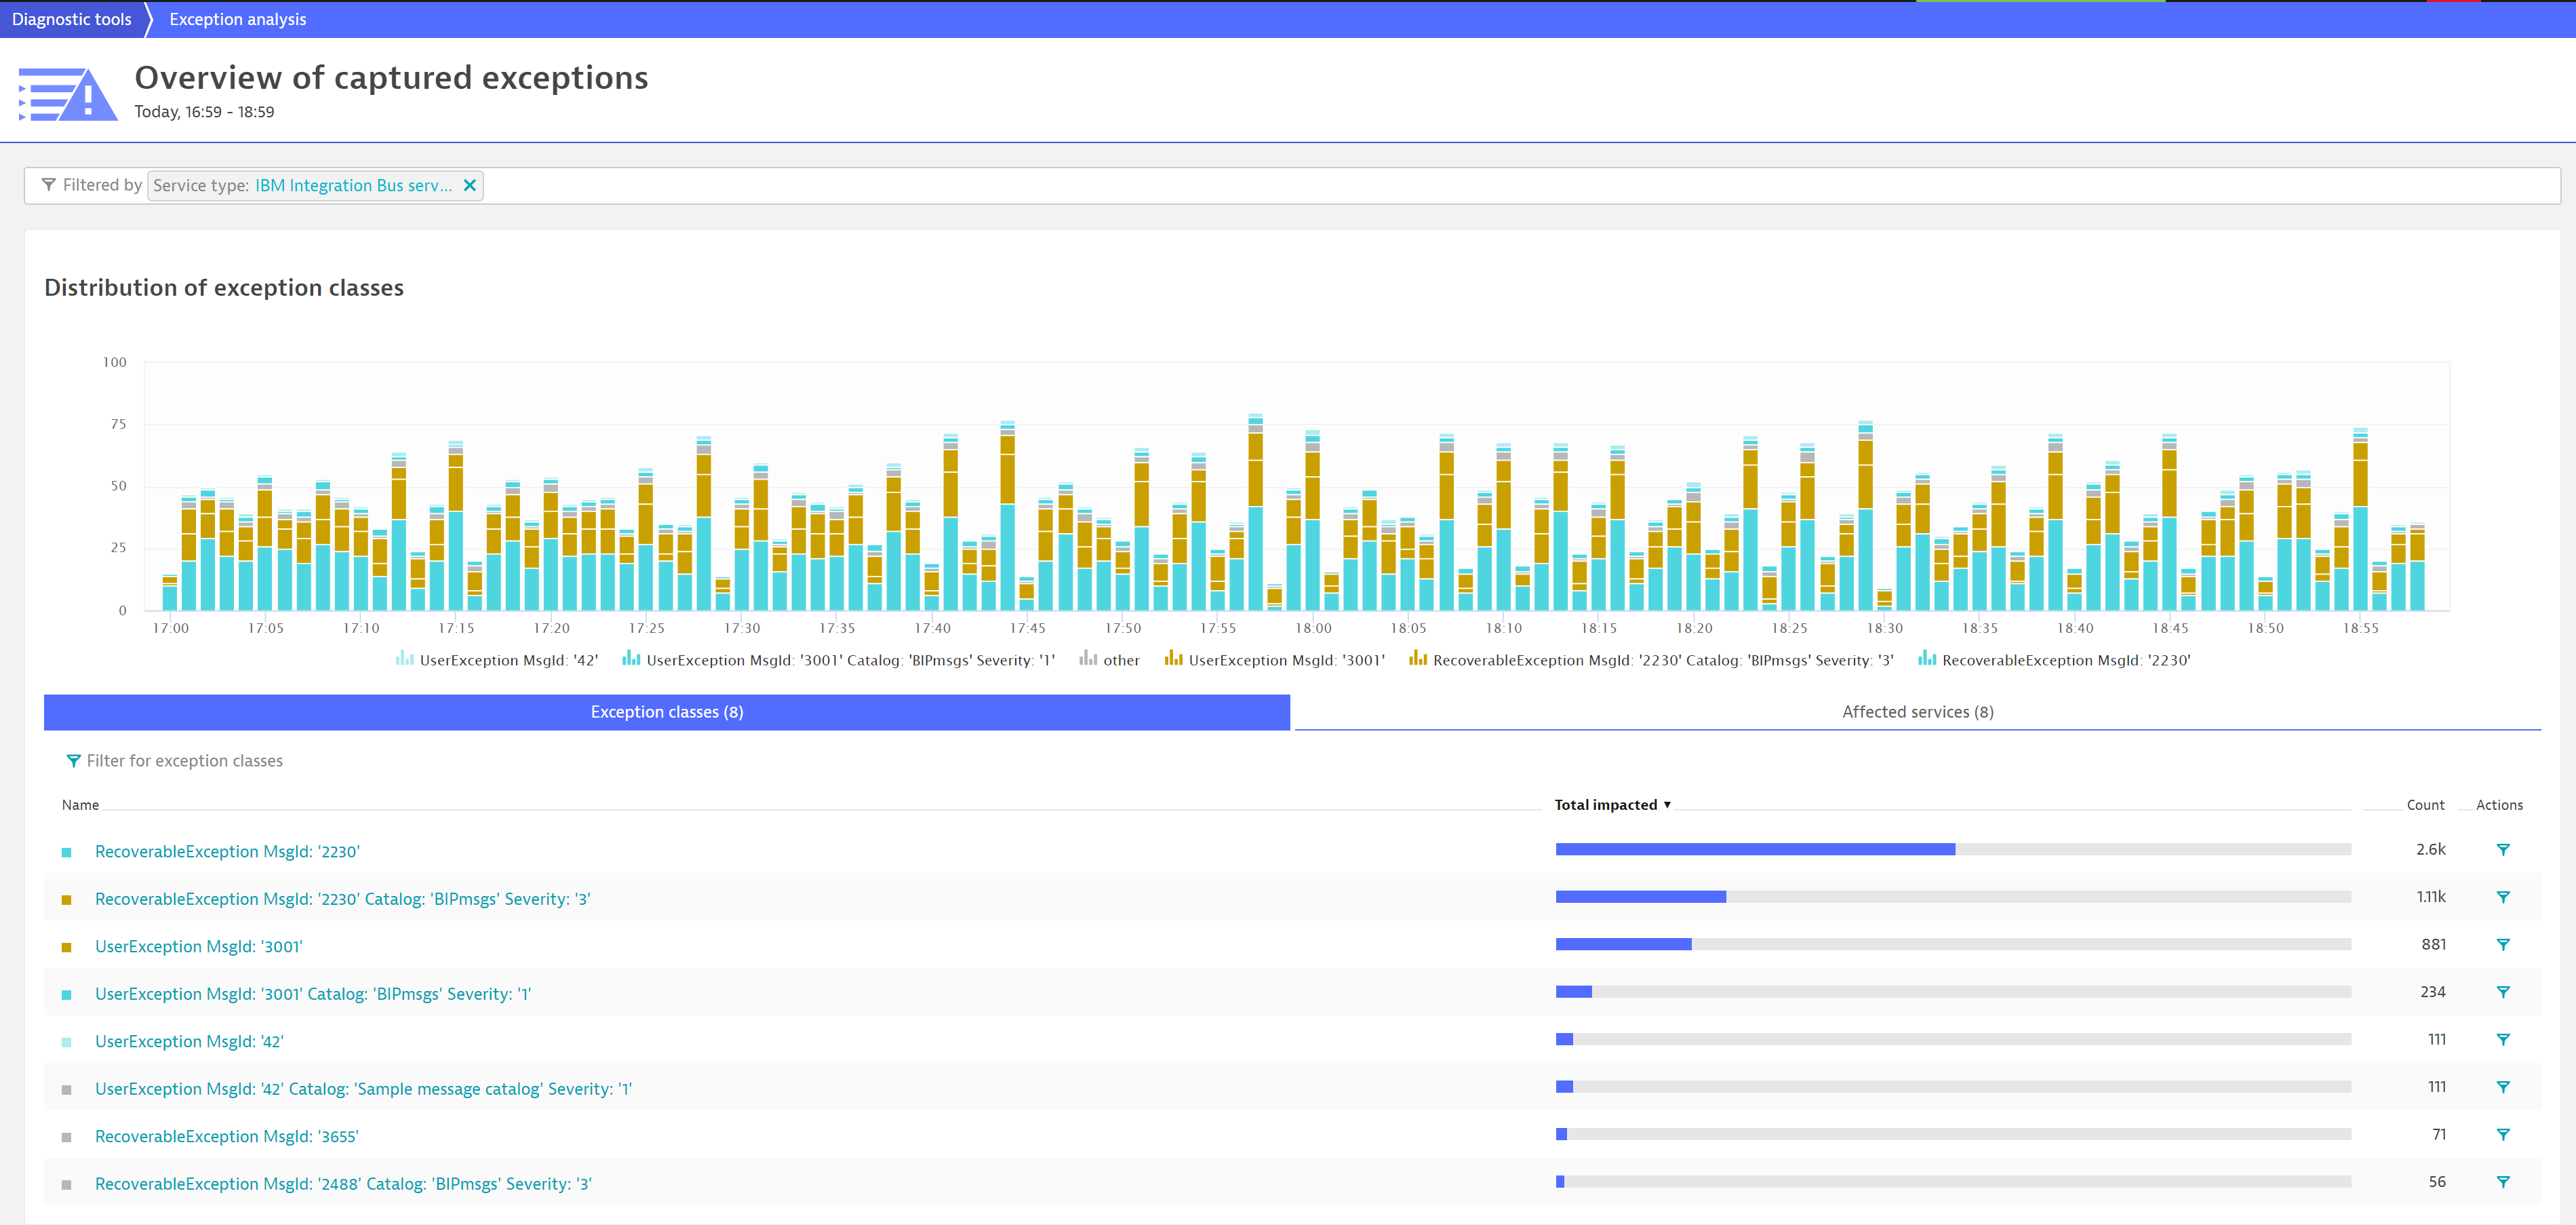
As Dynatrace now collects all of these exceptions out of the box, you can also find them in the global and service-focused exception overviews.
Request attributes based on IIB node names
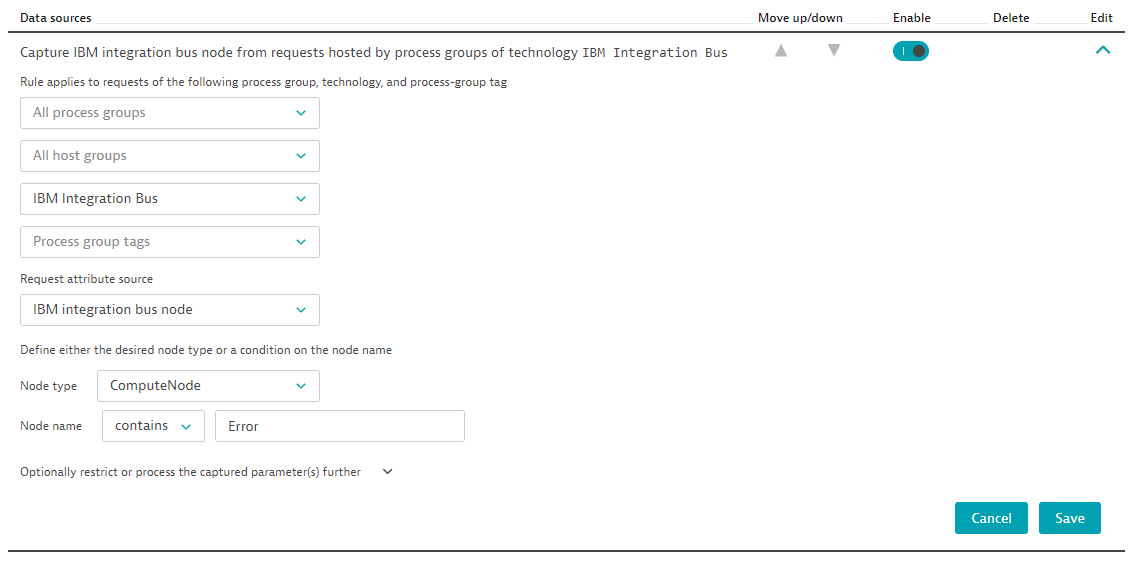
With Dynatrace version 1.170, we’ve also added the ability to define request attributes based on IIB node names. This allows you to add a request attribute to a message flow execution based on whether specific nodes have been traversed. The configuration shown below adds the request attribute IIBComputeError to a flow when the message traverses a ComputeNode whose name contains Error.
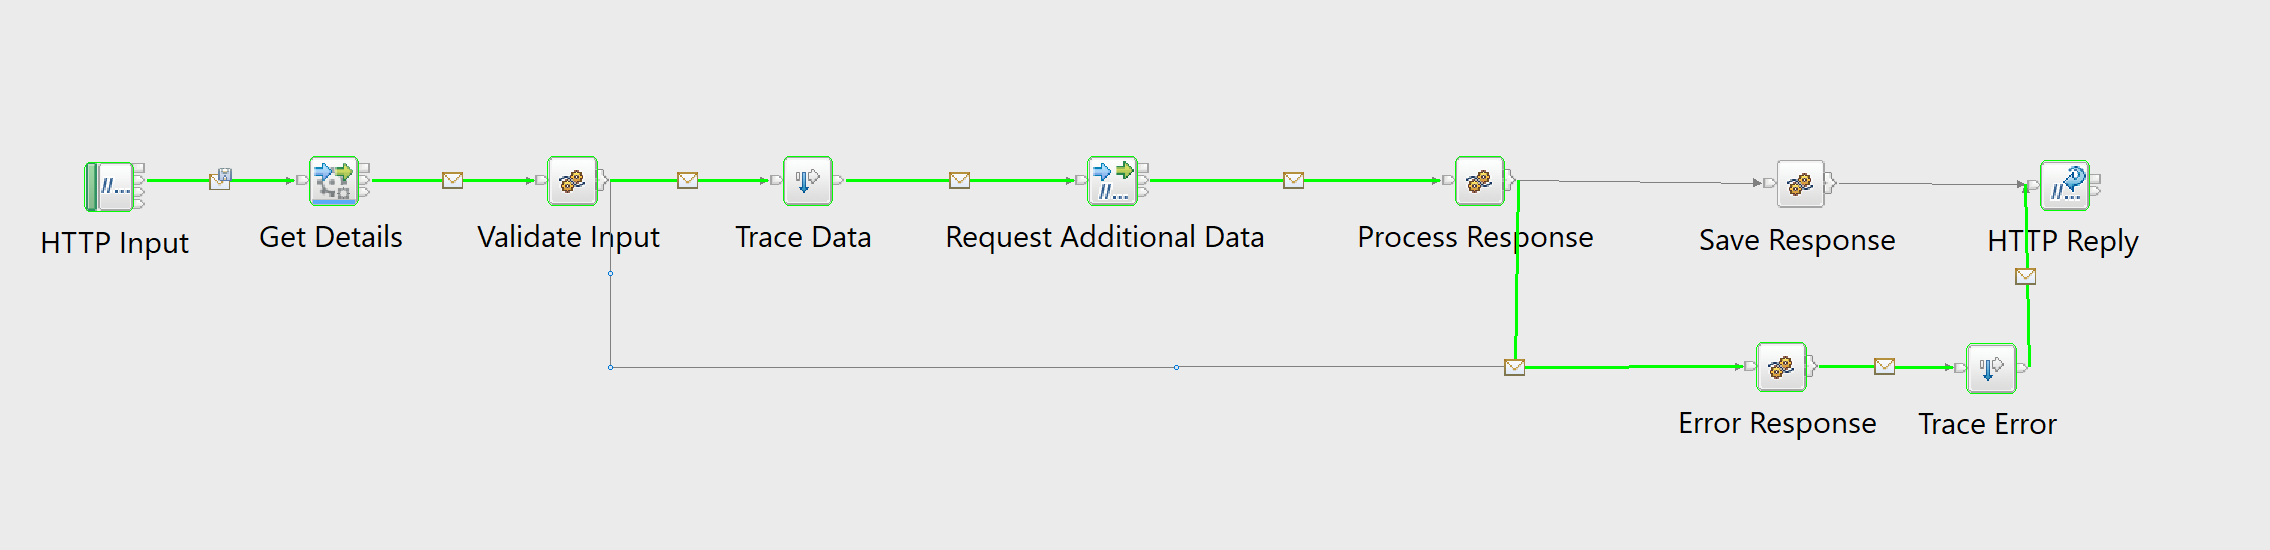
The message flow below stores the value Error Response on the call as the flow (highlighted in green) traverses the Error Response node during execution.
As soon as the request attribute is configured, it can be used like any other request attribute in Dynatrace for filtering requests, request naming, or even error detection.
What’s next?
In addition to our improved IIB error detection, you can expect several additional functionalities such as:
- Support for IBM Application Connect 11.
- Support for additional node types.
- Hotspot analyses for IIB nodes.
Start a free trial!
Dynatrace is free to use for 15 days! The trial stops automatically, no credit card is required. Just enter your email address, choose your cloud location and install our agent.


Looking for answers?
Start a new discussion or ask for help in our Q&A forum.
Go to forum