article thumbnail

So many bad takes?—?What is there to learn from the Prime Video microservices to monolith story

Adrian Cockcroft

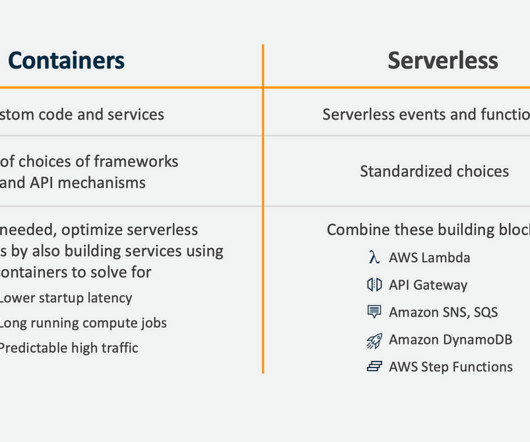
They state in the blog that this was quick to build, which is the point. His first edition in 2015 was foundational, and he updated it in 2021 with a second edition. When you are exploring how to construct something, building a prototype in a few days or weeks is a good approach. He is also clear about when microservices aren’t useful.

article thumbnail

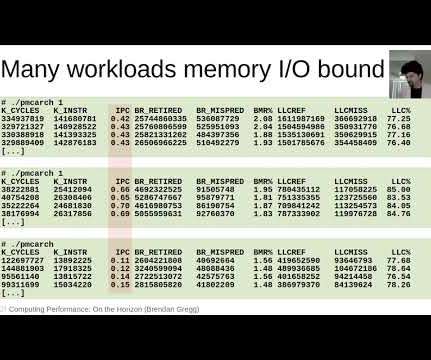
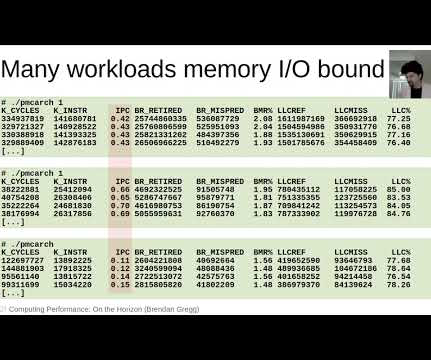
USENIX LISA2021 Computing Performance: On the Horizon

Brendan Gregg

## References I've reproduced the talk references below, so you can click on links: - [Gregg 08] Brendan Gregg, “ZFS L2ARC,” [link] Jul 2008 - [Gregg 10] Brendan Gregg, “Visualizations for Performance Analysis (and More),” [link] 2010 - [Greenberg 11] Marc Greenberg, “DDR4: Double the speed, double the latency? Ford, et al., “TCP

Insiders

Sign Up for our Newsletter

This site is protected by reCAPTCHA and the Google Privacy Policy and Terms of Service apply.

Trending Sources

article thumbnail

The Speed of Time

Brendan Gregg

A Cassandra database cluster had switched to Ubuntu and noticed write latency increased by over 30%. The change was obvious in the production graphs, showing a drop in write latencies: Once tested more broadly, it showed the write latencies dropped by 43%, delivering slightly better performance than on CentOS.

Speed 126
article thumbnail

Observability platform vs. observability tools

Dynatrace

Metrics are measures of critical system values, such as CPU utilization or average write latency to persistent storage. But by 2015, it was more common to split up monolithic applications into distributed systems. The post Observability platform vs. observability tools appeared first on Dynatrace blog. Watch webinar now!

article thumbnail

What Adrian Did Next: 2022 Conference Appearances

Adrian Cockcroft

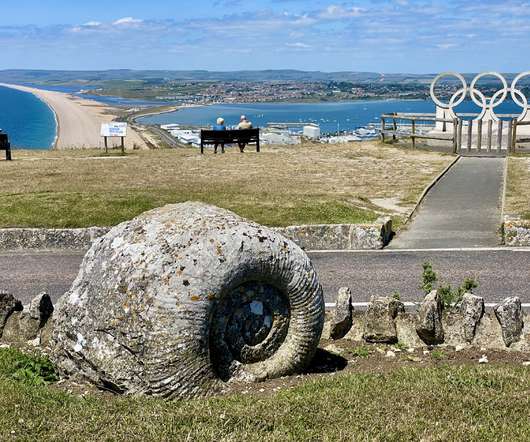
photo by Adrian I gave a talk at Monitorama in Portland Oregon in June, which set out the idea that carbon is just another metric to monitor, and that in a few years most of the monitoring and performance tuning tools are going to be reporting and optimizing for carbon alongside latency, throughput, availability and cost.

AWS 52
article thumbnail

How To Add eBPF Observability To Your Product

Brendan Gregg

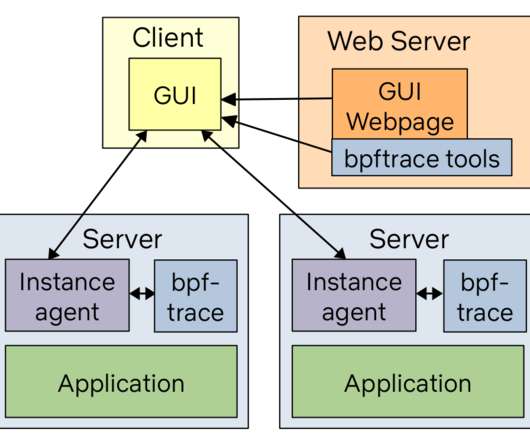
biolatency Disk I/O latency histogram heat map. runqlat CPU scheduler latency heat map. We'll likely open source the new one at some point and have a post about it on the Netflix tech blog. ## Case study: Facebook Facebook are advanced users of BPF, but deep details of how they run the tools fleet-wide aren't fully public.

Latency 145
article thumbnail

USENIX LISA2021 Computing Performance: On the Horizon

Brendan Gregg

## References I've reproduced the talk references below, so you can click on links: - [Gregg 08] Brendan Gregg, “ZFS L2ARC,” [link] Jul 2008 - [Gregg 10] Brendan Gregg, “Visualizations for Performance Analysis (and More),” [link] 2010 - [Greenberg 11] Marc Greenberg, “DDR4: Double the speed, double the latency? Ford, et al., “TCP