
To enable release risk assessment and decision making, Dynatrace now provides guidance and templates for setting up Service-Level Objectives (SLOs) with the right metrics, combined with powerful analytics and problem root-cause detection.
Our customers are increasingly transitioning to agile software development, DevOps, and progressive continuous delivery to deliver business value faster. To speed up release frequency, they’re investing in delivery-pipeline automation. The flip side of speeding up delivery, however, is that each software release comes with the risk of impacting your goals of availability, performance, or any business KPIs.
To speed up delivery, you need to automate not just delivery but also the process of deciding whether it is safe and risk-free to deliver the next change into production (which might include a wide range of changes, such as deploying a new microservice, enabling a feature flag, scaling your pods on Kubernetes, or including a new third-party service). Confidence for a safe release is provided by more validation of how the changes impact quality, for example, before deploying to production or with impact analysis during blue/green deployments. In these circumstances, Site Reliability Engineering teams face two big challenges:
- Measuring uptime is not enough anymore.
We are moving from static to very dynamic infrastructure and applications. The modern IT landscape is driven by the automatic scaling of compute nodes and highly dynamic provisioning capabilities within Kubernetes clusters. Just measuring the uptime of service tells you nothing about health or quality.
- Which metrics are relevant for your business, anyway?
Modern observability tools provide many metrics, but which ones are really important for your business? Automating any decision-making based on release risks requires domain knowledge and an understanding of business impact. You need to consider what services are provided by the software to be released, what legal service-level agreements (SLAs) are set up, and how any software release or configuration change could impact SLAs. (Read more about the basics of Site Reliability Engineering below.)
We’re happy to announce that Dynatrace now provides guidance and templates for setting up Service-Level Objectives (SLOs) with the right metrics, gives you all the facts, and combines this with the powerful analytics of problem root-cause detection. All you need is to make a confident decision about whether to push the release button—with respect to release risks or any quality degradation.
Scale and automate SRE into your delivery processes with Dynatrace
The Dynatrace Software Intelligence Platform delivers all the necessary Service-Level Indicators (SLIs) for defining your Service-Level Objectives (SLOs) and monitors the status and error budgets of those objectives. Whether you want to define an SLO for real user experience or for measuring your service availability, your Dynatrace monitoring environment already comes with the right tools for your Site Reliability Teams. You can get all the facts about the health of your critical business services with respect to Business and Service-Level Objectives (SLO), Service-Level Agreements (SLAs), and end-user experience:
- Get more than 2000 different metrics ready for use as dedicated SLIs
Depending on the service, an SRE team’s responsibility is to find the best indicators that prove the successful delivery of the service to the customer. Dynatrace offers more than 2000 different metrics that are ready for use as dedicated SLIs.
- Choose from a range of ready-to-use SLO use cases
As you might find it hard to select a good indicator metric for various use cases, Dynatrace offers a collection of out-of-the-box SLO templates that support major use cases for your monitoring environment.
Typical Dynatrace use cases cover SLOs for service availability, web application performance, mobile application availability, and synthetic availability. Each action button in the SLO wizard selects one of these important templates.
- Get Davis AI-powered notifications about detected anomalies with actionable root causes
Other solutions on the market trigger alerts for SLO status and error budget burn-down rates. As SLOs are typically defined over longer periods of time, this approach gives teams very late notification of an existing problem in production. Also, once an SLO turns red, the SRE team’s immediate question about the cause of the issue is still unanswered when the SLO metric alone doesn’t offer much by way of an answer.
On the other hand, the Dynatrace AI causation engine Davis® provides both quick notifications for detected anomalies as well as actionable root causes. This also means that when your SLO turns red, it’s very likely that you’ve already received a Davis notification that informs you of the problem as well as shows what the root cause of the situation is.
Note: We will soon improve the drill-downs to Davis problems directly from existing SLO definitions so that SRE teams can benefit more from the Dynatrace Davis AI engine.
- Build your own Site Reliability Engineering dashboards
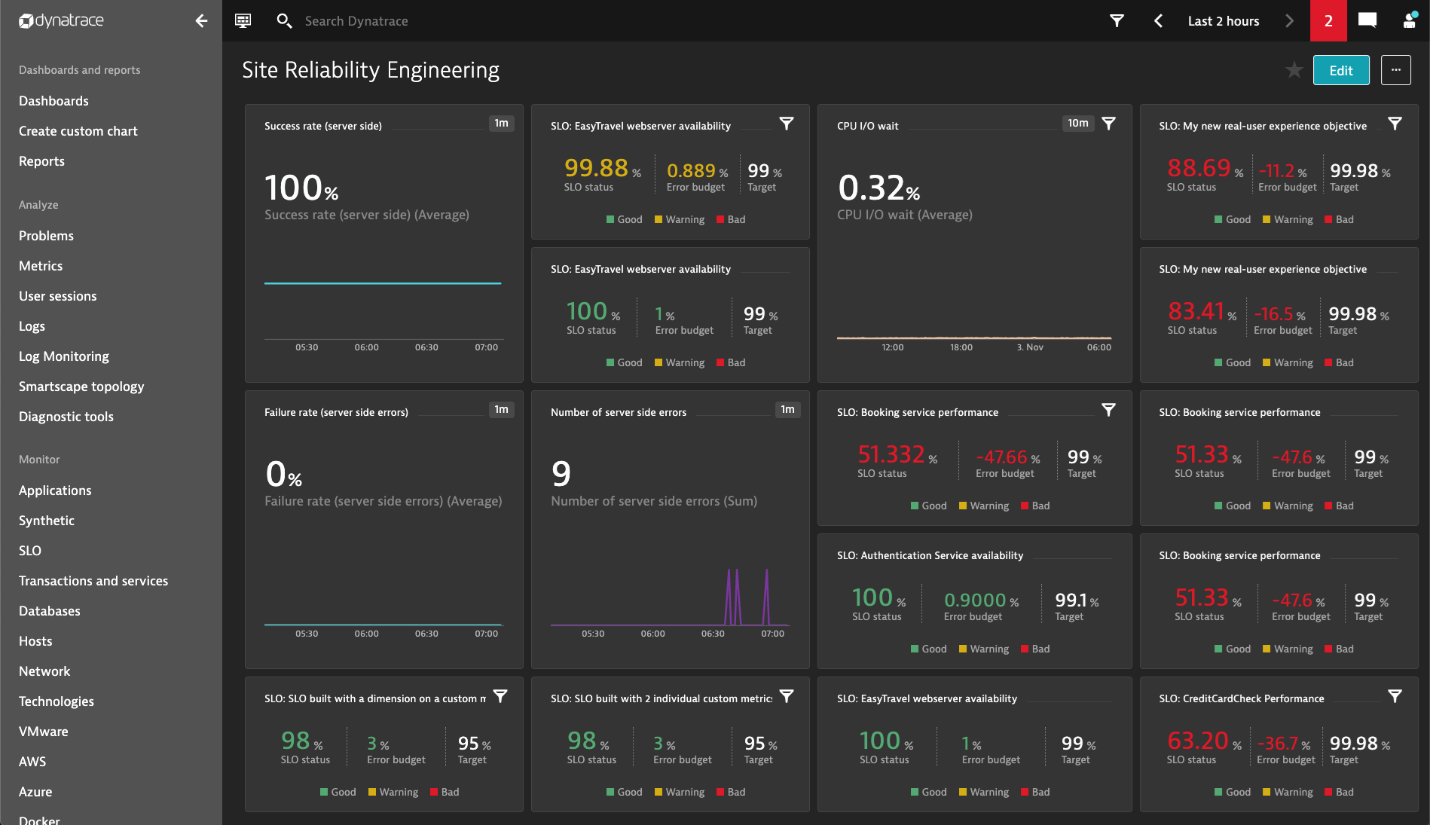
Once you’ve selected your SLI metrics and successfully defined your list of SLOs in Dynatrace, you can build your own Site Reliability Engineering (SRE) dashboards by adding SLO tiles alongside your other important monitoring data.
Now let’s dive deeper into how Dynatrace can be used to support your Site Reliability Engineering process.
Scale Site Reliability Engineering with SLOs in Dynatrace
Selecting metrics of interest and creating SRE dashboards has already been possible in Dynatrace for a while (for example, for public APIs with Synthetic monitors and for automated SRE-driven performance engineering). With our latest updates, we’ve put Service-Level Objectives front and center by making SLO monitoring a new, top-level capability accessible from the Dynatrace navigation menu (shown in the screenshot below). The Dynatrace SLO page gives your SRE team full access to defining and observing your SLOs.
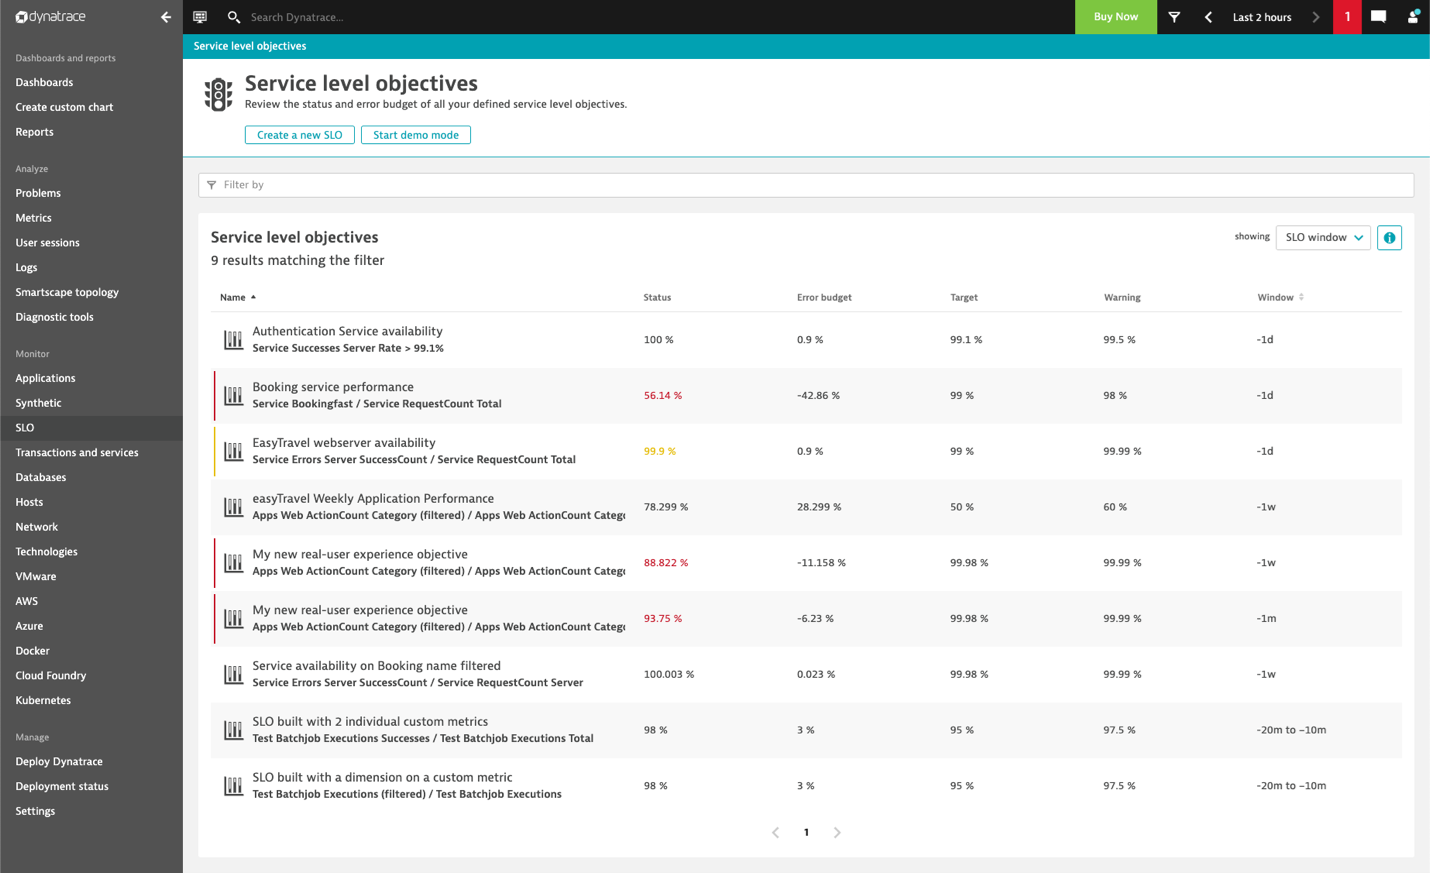
The SLO list in a Dynatrace monitoring environment displays the most important information such as the current status, error budget, defined target, and an additional warning target along with the evaluation window.
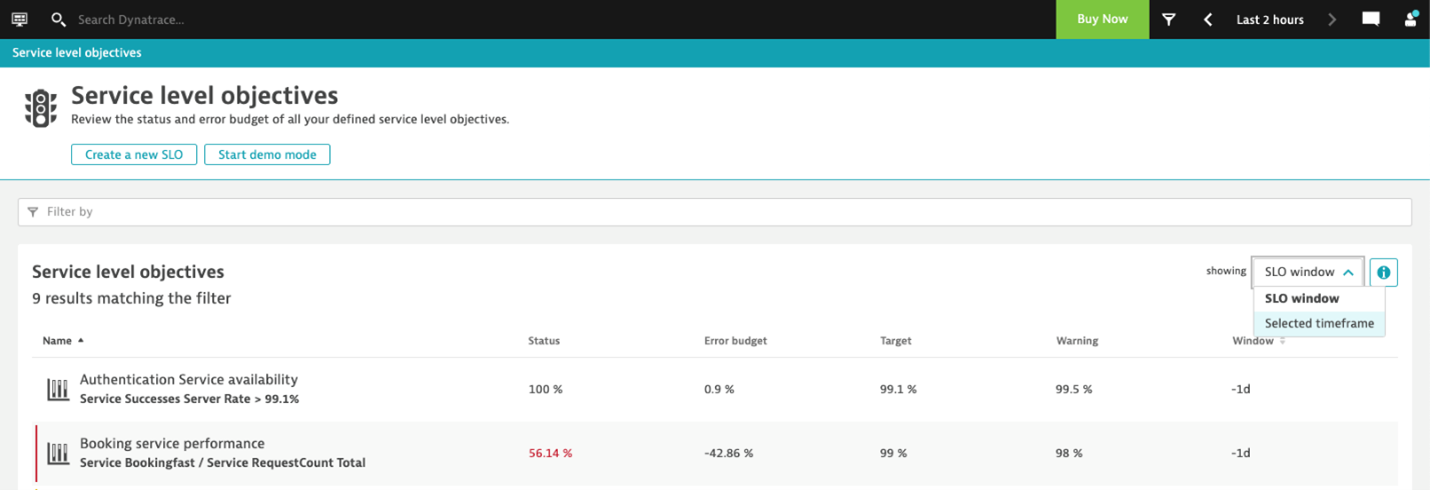
By default, each SLO is evaluated according to its defined time window, but you have the ability to temporarily switch the evaluation to use the global timeframe instead. This helps to perform dynamic what-if analysis with different timeframes and to look back in time. The screenshot below shows how to switch between evaluation timeframes:
Select Create a new SLO to launch the SLO-creation wizard that guides you through the definition of a new Service-Level Objective. The SLO wizard gives you guidance on creating SLOs based on the metrics (SLIs) Dynatrace monitors for your environment.
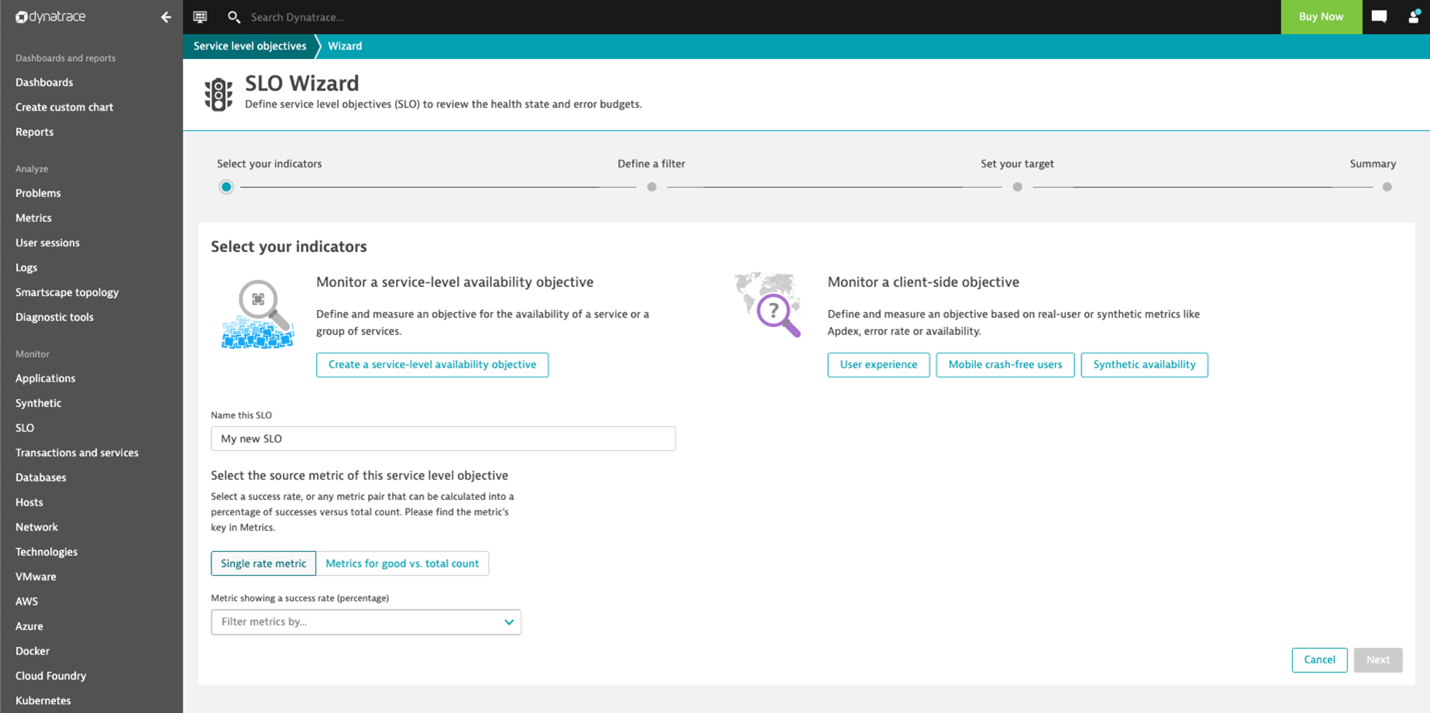
The SLO wizard allows you to select either one SLI percentage metric such as the Service success rate (Single rate metric) or two metrics that represent the “Good count” divided by the “Total count” such as the Number of service calls without error divided by the Total number of service calls (Metrics for good vs. total count).
As you might find it hard to select a good indicator metric for various use cases, Dynatrace offers a collection of out-of-the-box SLO templates that support major use cases—service availability, web application performance, mobile app availability, and synthetic availability. (See the action buttons in the screenshot above for each of these important templates.)
Once you’ve selected your SLI metrics and successfully defined the list of your SLOs, you can show SLO statuses directly in your Dynatrace dashboards. Build your own Site Reliability Engineering (SRE) dashboards by adding Service-level objective tiles next to your other important monitoring data.
We ourselves have a long history of using Dynatrace for progressive delivery at cloud scale, leveraging SRE concepts to make faster decisions on whether “To Release or Not Release” a new product version to our customer base. Over the past months, we’ve also worked very closely with Google to bring new SLO capabilities into our Software Intelligence Platform to enable all our users to scale their SRE practices.
Site Reliability Engineering 101
Site Reliability Engineering was a term introduced by Ben Treynor Sloss, Google’s VP for 24/7 Operations, who first claimed that reliability was the most fundamental feature of any product.
Google has a long history of shaping SRE processes for their global-scale services that are dedicated to making their services more scalable, reliable, and efficient. Read more:
- Google’s definition of the term Site Reliability Engineering
- Release decision making with Service-Level Objectives (SLOs)
- Site reliability engineering: 5 things to you need to know
Finding good Service-Level Indicators (SLIs)
The purpose of an SRE team is to define and monitor the level of service fulfillment towards the customer and to manage the risk around that fulfillment.
In principle, it doesn’t really matter if the focus is a software service, such as an online payment process, or buying a Coke at a traditional vending machine. What matters is how reliably this service is delivered to the customer.
An SRE team’s means of measuring the delivery of a service to a customer is to find dedicated indicators, so-called Service-Level Indicators (SLI), that can prove successful service delivery. So the SRE team is responsible for finding good SLIs for a given service that closely monitors the reliable delivery of a service to the customer.
SLIs can be different per service, as not all services are equally critical in terms of time and error constraints.
Here are some examples:
- The successful request of a payment service depends highly on not returning an error on valid data and on finishing within three seconds.
- A music-streaming service depends on the continuous delivery of media packages while the loss of some of those packages is not overly critical.
Dynatrace offers more than 2000 different metrics that are ready for use as dedicated SLIs. While this is great, it might be overwhelming for many (“Which SLIs are right for me?”).
Dynatrace has already prepared a selection of SLO use cases along with recommended SLI metrics in our SLO-creation wizard. See more about our SLO wizard for the Dynatrace-recommended, ready-to-use SLO use cases. Once the SRE team has found and agreed upon a collection of good indicator metrics, what remains is to define and monitor the operational goal with a Service-Level Objective (SLO).
Defining your target by setting a Service-Level Objective (SLO)
Choosing the right target for your Service-Level Objective (SLO) is a tedious task and requires expert knowledge about the measured service. As services are, of course, highly dependent on the user context, not all indicators are equally appropriate in very strict SLO target definitions.
For example, the service response time is heavily dependent on the customer’s location, browser, and client device. A service that delivers perfect results within milliseconds in most cases could take ages on an outdated mobile device running in low bandwidth geolocation.
Dynatrace offers a lot of expertise in terms of measuring the real user experience of delivered services directly on the client-side. Dynatrace metrics such as the Apdex (Application Performance Index) or the User experience score can directly be used in an SLO definition (as we’ll show in the examples below).
As defined by Google, a typical SLO consists of the following fundamental information:
- Service-Level Indicator (SLI): The indicator used to measure successful service delivery—SLIs typically refer to metrics such as service success rate, crash-free mobile app users, successful synthetic test runs, or response time.
- Target: The target defines the planned goal to achieve in terms of service delivery. A target could be that 99.99% of all service calls must return without an error or that 95% of all service requests must be fulfilled in under 2 seconds’ response time.
- Evaluation period: The evaluation period is necessary to standardize communication concerning the SLO result. Without a defined evaluation period, one person could talk about 100% availability within the last 24 hours, while another person comes to a different conclusion of 95% availability looking at the same SLO over the period of the last week.
Given the fundamental ingredients above, each SLO definition can be evaluated by following two metrics:
- SLO status: The current evaluation result of the SLO, expressed as a percentage—The semantics of this percentage (for example, 99.3% of all service requests are successful, or 99.99% of all website users are “satisfied” in terms of Apdex rating) and the target defined for this percentage is up to the SRE team.
Again, the SLO status must be normalized towards a percentage value in the range of 0–100%!
- SLO error budget: The error budget represents the buffer remaining until the defined SLO target is considered as failed. For example, if an SLO defines a 95% target and its current SLO status is evaluated at 98%, the remaining error budget is the difference between the status and target.
Support for release decisions: Shift-Left of SLO evaluation for new software releases
While “never change a running system” might be the precept when SLOs are in place, we might still want to release new features with confidence, without the risk of violating SLOs in production after a release. A new software release can always impact SLOs, and this comes with even more risks if there is only a small error budget remaining in production. A release rollout should be stopped automatically if newer versions are worse with regard to SLO evaluation. This can be detected during any canary deployment or blue/green traffic routing to a new version.
However, SLOs at risk with a new release can also be detected in pre-production environments by evaluating the SLOs as part of your delivery pipeline’s quality gate. In the end, SLOs are just metrics compared against your objectives. This concept can also be applied to continuous delivery where a response-time objective might be “Login must be faster than 100 ms” or “Login should not be slower as compared to a previous build!”
To learn more about SLO-driven quality gates, read and watch SRE-inspired DevOps automation via Keptn, integrated with Dynatrace.
Summary
Site Reliability Engineering represents an important methodology for embracing and managing risk while deploying and providing software services at a global scale.
Dynatrace, as the leading platform for software intelligence, delivers all the necessary Service-Level Indicators (SLIs) for defining your Service-Level Objectives (SLOs) and offers tools for monitoring the status and error budgets of those objectives. Whether you want to define an SLO for real user experience or for measuring your service availability, your Dynatrace monitoring environment already comes with the right tools for your Site Reliability Teams.
Get started with Dynatrace version 1.207 defining your first SLO using our templates, enrich your dashboards with SLO tiles, and create your dedicated SRE dashboards!
Stay tuned for more release advice as well as automation provided by Dynatrace for release risk management and automated release decision making based on SLOs.
Start a free trial!
Dynatrace is free to use for 15 days! The trial stops automatically, no credit card is required. Just enter your email address, choose your cloud location and install our agent.


Looking for answers?
Start a new discussion or ask for help in our Q&A forum.
Go to forum